nf-core/hgtseq
A pipeline to investigate horizontal gene transfer from NGS data
Introduction
This document describes the output produced by the pipeline. Most of the plots are taken from the MultiQC report, which summarises results at the end of the pipeline.
The directories listed below will be created in the results directory after the pipeline has finished. All paths are relative to the top-level results directory.
Pipeline overview
The pipeline is built using Nextflow and processes data using the following steps:
- Pipeline information - Report metrics generated during the workflow execution
- Preprocess
- Trimming
- TrimGalore - Read Trimming
- Alignment
- BWAmem - Read mapping to reference genome
- SAMtools - Sorting, indexing, filtering & stats generation of BAM file
- Extracted Reads
- SAMtools - Extracting reads by sam flag
- Converted Reads
- SAMtools - Converting reads to fastq format
- Parseoutputs - Parsing reads to get only sample name, chr and position to investigate integration sites
- Trimming
- Results
- Classified
- GAWK - Collated reads
- Kraken2 - Taxonomic classification
- Analysis Report - RMarkDown report
- Krona Plots
- KronaTools - Interactive multi-layered pie charts
- Classified
- Quality Control
- FastQC - Raw read QC
- MultiQC - Aggregate report describing results and QC from the whole pipeline
- Qualimap - Quality control of alignment sequencing data
- Bamtools - General alignment statistics from the BAM file
Pipeline information
Output directory: pipeline_info/
- Reports generated by Nextflow:
execution_report.html,execution_timeline.html,execution_trace.txtandpipeline_dag.dot/pipeline_dag.svg. - Reports generated by the pipeline:
pipeline_report.html,pipeline_report.txtandsoftware_versions.yml. Thepipeline_report*files will only be present if the--email/--email_on_failparameter’s are used when running the pipeline. - Reformatted samplesheet files used as input to the pipeline:
samplesheet.valid.csv.
Nextflow provides excellent functionality for generating various reports relevant to the running and execution of the pipeline. This will allow you to troubleshoot errors with the running of the pipeline, and also provide you with other information such as launch commands, run times and resource usage.
Preprocess
Trimming
Output directory: preprocess/
trimming/sample01_1.fastq.gz_trimming_report.txt: Report of the trimming performed, with all the run statistics.sample01_1_val_1.fq.gz: Fastq reads after adapter trimming.sample01_2.fastq.gz_trimming_report.txt: Report of the trimming performed, with all the run statistics.sample01_2_val_2.fq.gz: Fastq reads after adapter trimming.version.yml: All these files in the pipeline show the software version used in that specific process.
TrimGalore is used for removal of adapter contamination and trimming of low quality regions. TrimGalore uses Cutadapt for adapter trimming and runs FastQC after it finishes.
Alignment
Output directory: preprocess/
alignment/sample01.bam: BAM file generated by initial alignmentsample01_sorted.bam: Sorted BAM file by coordinatesample01_sorted.bam.bai: Sorted BAM index file by coordinateversions.yml: File with the versions of BWA and SAMtools used
BWA is a software package for mapping low-divergent sequences against a large reference genome, such as the human genome. It consists of three algorithms: BWA-backtrack, BWA-SW and BWA-MEM. BWA-MEM and BWA-SW share similar features such as long-read support and split alignment, but BWA-MEM, which is the latest, is generally recommended for high-quality queries as it is faster and more accurate.
SAMtools is a suite of programs for interacting with high-throughput sequencing data.
Extracted Reads
Output directory: preprocess/
exctracted_reads/single_unmapped/sample01.bam: BAM file with reads extracted by SAM bitwise flag 5version.yml: File with SAMTools version used
both_unmapped/sample01.bam: BAM file with reads extracted by SAM bitwise flag 13version.yml: File with SAMTools version used
SAMtools is a suite of programs for interacting with high-throughput sequencing data. We used this command to extract reads by sam flag (single unmapped and both unamapped)
Converted Reads
Output directory: preprocess/
converted_reads/single_unmapped/sample01_1.fastq.gz: Reads, previuosly extracted, now converted from BAM to Fastq to accomodate Kraken2 input requirementssample01_2.fastq.gz: Reads, previuosly extracted, now converted from BAM to Fastq to accomodate Kraken2 input requirementsversion.yml: File with the SAMtools version used
both_unmapped/sample01_1.fastq.gz: Reads, previuosly extracted, now converted from BAM to Fastq to accomodate Kraken2 input requirementssample01_2.fastq.gz: Reads, previuosly extracted, now converted from BAM to Fastq to accomodate Kraken2 input requirementsversion.yml: File with the SAMtools version used
parsed_integration_sites/sample01_parsed_integration_sites.txt: File containing specific info from the reads classified that allows us to investigate for integration sites (i.e. sample name, chromosome and position of the relative read)version.yml: File with the SAMtools version used
SAMtools is a suite of programs for interacting with high-throughput sequencing data
Parseoutputs is our local module that allows us to parsing reads to get only the informations we need to perform analyzes in following R report.
Results
Classified
Output directory: results/
classified/single_unmapped/sample01.kraken2.classifiedreads.txt: File containing reads info after Kraken2 classificationsample01.kraken2.report.txt: Classification in the Kraken2 report format.version.yml: File with the Kraken2 version used
both_unmapped/sample01.kraken2.classifiedreads.txt: File containing reads info after Kraken2 classificationsample01.kraken2.report.txt: Classification in the Kraken2 report format.version.yml: File with the Kraken2 version used
collate_kraken/single_unmapped/kraken_classified_reads_collated.txt: File with all samples group to generated only one krona chartversion.yml: File with the Gawk version used
both_unmapped/kraken_classified_reads_collated.txt: File with all samples group to generated only one krona chartversion.yml: File with the Gawk version used
Kraken2 is the newest version of Kraken, a taxonomic classification system using exact k-mer matches to achieve high accuracy and fast classification speeds. This classifier matches each k-mer within a query sequence to the lowest common ancestor (LCA) of all genomes containing the given k-mer. The k-mer assignments inform the classification algorithm.
GAWK is a local module we built in order to collate all classified reads. The awk utility interprets a special-purpose programming language that makes it possible to handle simple data-reformatting jobs with just a few lines of code.
Analysis Report
Output directory: results/
analysis_report/analysis_report.htmlanalysis_report.RData
RMarkDown provides an authoring framework for data science and its documents are fully reproducible and support dozens of static and dynamic output formats.
The analysis_report.html has two mainly functions:
- it contains a function that assigns a score to each reads based on the kmers analyzed by Kraken2
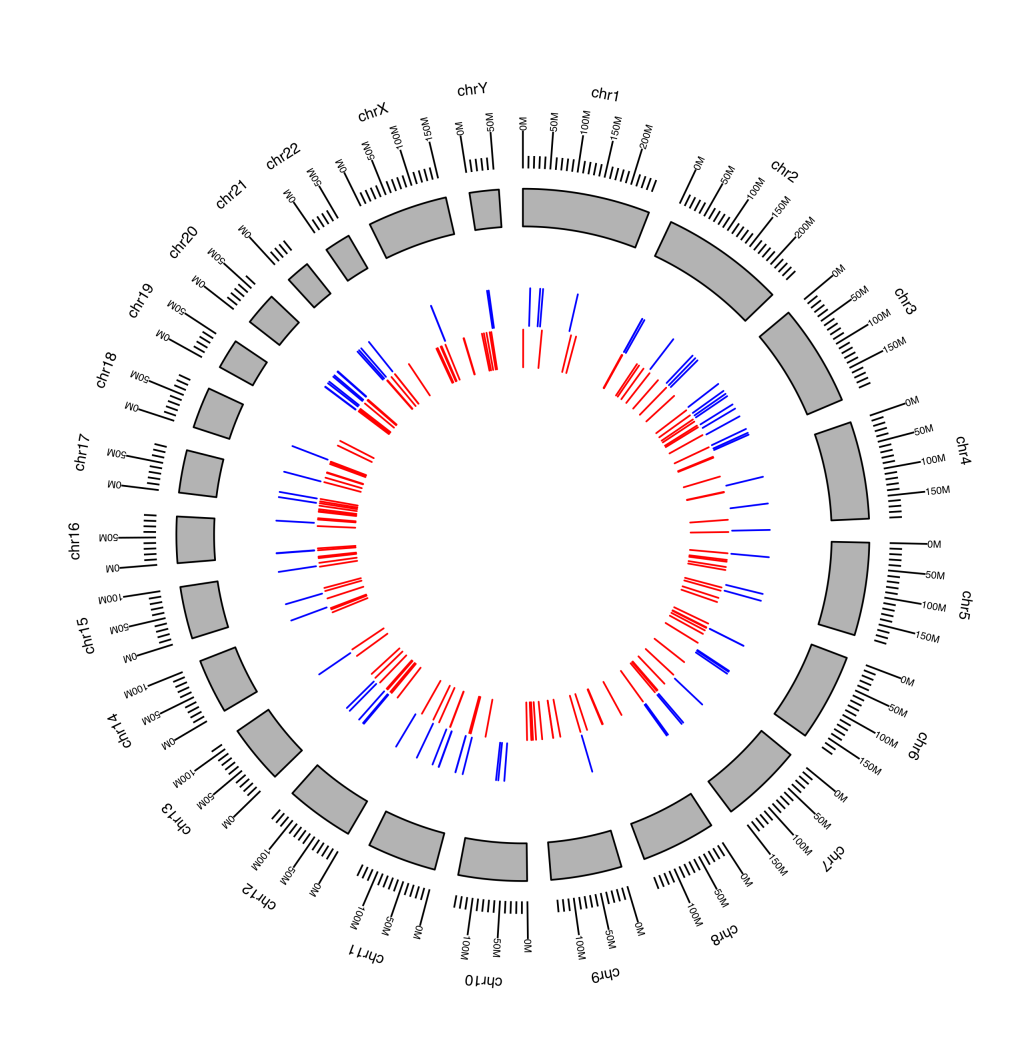
- it displays a circular plot (made with GenomicRanges & ggbio R packages), which graphically shows the specific position on the chromosome of each read.
Krona Plots
Output directory: results/
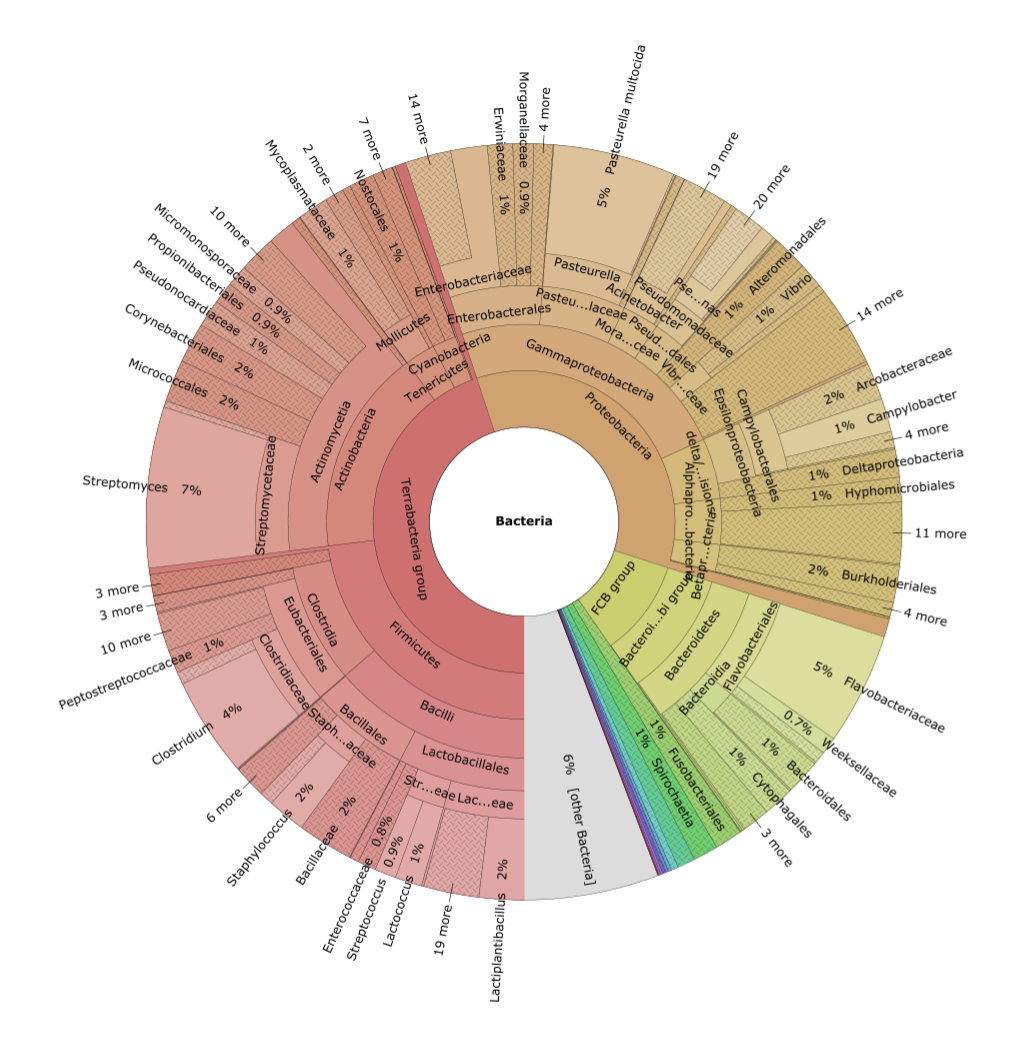
kronaplots/single_unmapped/group.html: Interactive pie chart produced by KronaToolsversion.yml: File with the Krona version used
both_unmapped/gropu.html: Interactive pie chart produced by KronaToolsversion.yml: File with the Krona version used
KronaTools allows hierarchical data to be explored with zooming, multi-layered pie charts. KronaTools can be used to create Krona charts from several bioinformatics tools and raw data formats. The resulting interactive charts are self-contained and can be viewed with any modern web browser.
Quality Control
FastQC
Output directory: QC/
fastqc_raw/*_fastqc.html: FastQC report containing quality metrics.*_fastqc.zip: Zip archive containing the FastQC report, tab-delimited data file and plot images.
fastqc_trimmed/*_fastqc.html: FastQC report containing quality metrics.*_fastqc.zip: Zip archive containing the FastQC report, tab-delimited data file and plot images.
FastQC gives general quality metrics about your sequenced reads. It provides information about the quality score distribution across your reads, per base sequence content (%A/T/G/C), adapter contamination and overrepresented sequences. For further reading and documentation see the FastQC help pages.
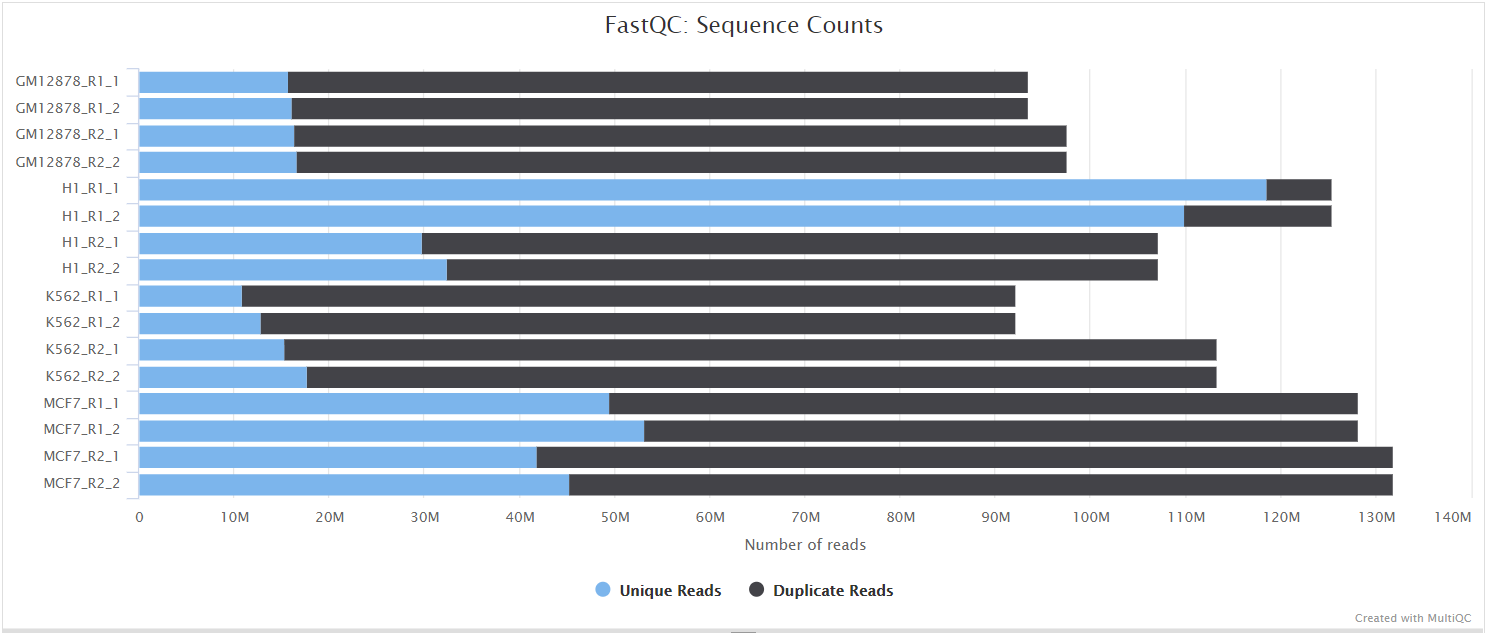
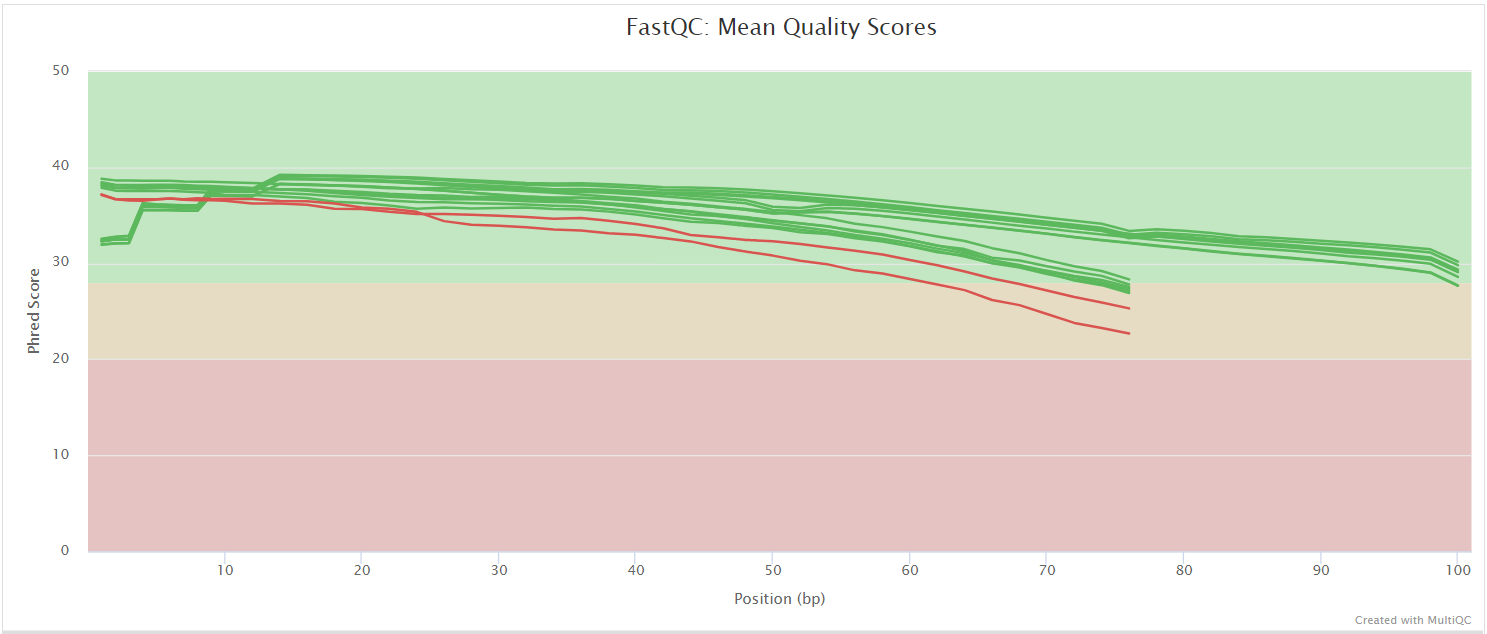
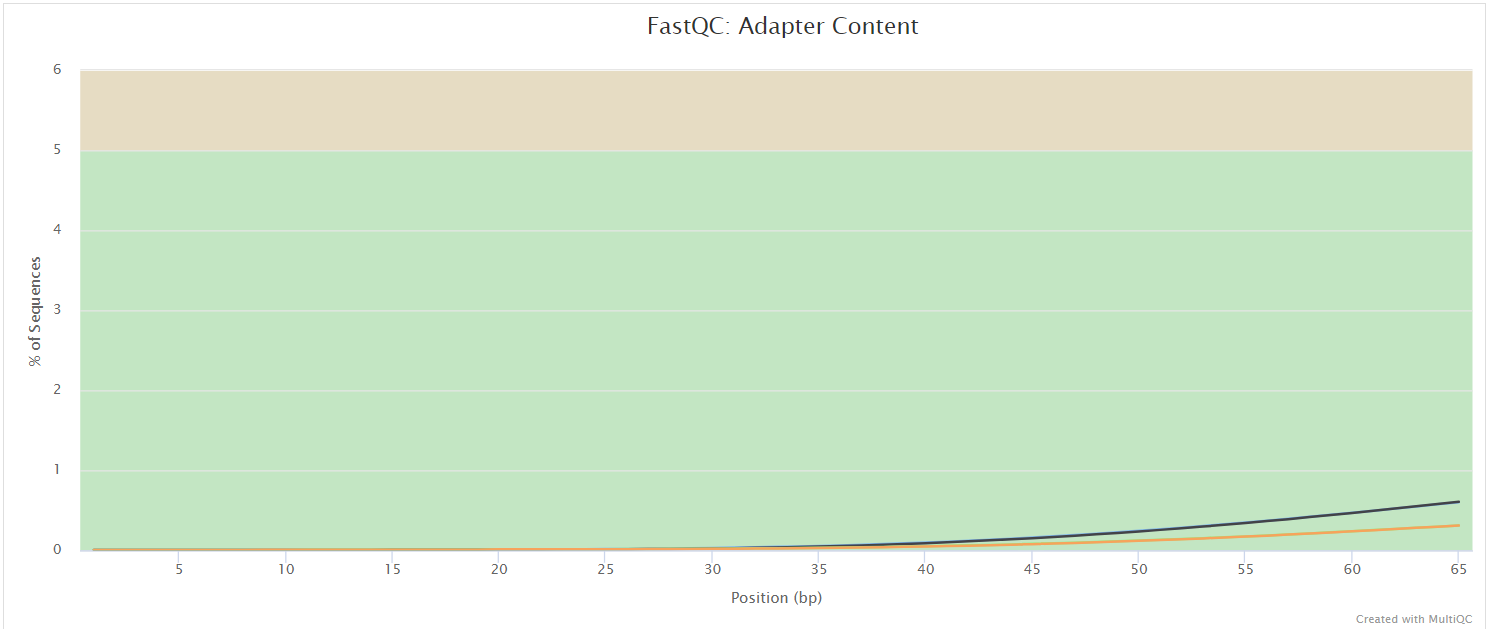
NB: The FastQC plots displayed in the MultiQC report shows untrimmed reads. They may contain adapter sequence and potentially regions with low quality.
MultiQC
Output directory: QC/
multiqc/multiqc_report.html: a standalone HTML file that can be viewed in your web browser.multiqc_data/: directory containing parsed statistics from the different tools used in the pipeline.multiqc_plots/: directory containing static images from the report in various formats.
MultiQC is a visualization tool that generates a single HTML report summarising all samples in your project. Most of the pipeline QC results are visualised in the report and further statistics are available in the report data directory.
Results generated by MultiQC collate pipeline QC from supported tools e.g. FastQC. The pipeline has special steps which also allow the software versions to be reported in the MultiQC output for future traceability. For more information about how to use MultiQC reports, see http://multiqc.info.
Qualimap
Output directory: QC/
qualimap/<samplename>/css/genome_results.txt: BamQC reportimages_qualimapReport/qualimapReport.html: Qualimap Report, html BamQCraw_data_qualimapReport/
Qualimap is a platform-independent application written in Java and R that provides both a Graphical User Inteface (GUI) and a command-line interface to facilitate the quality control of alignment sequencing data and its derivatives like feature counts.
Qualimap examines sequencing alignment data in SAM/BAM files according to the features of the mapped reads and provides an overall view of the data that helps to the detect biases in the sequencing and/or mapping of the data and eases decision-making for further analysis.
Bamtools
Output directory: QC/
bamtools/stats/sample01.bam.stats: BAM file stats
The SAM/BAM format is a standard format for short read alignments. While SAM is the plain-text version of the alignments, BAM is compressed, binary format of the alignments that is used for space-saving. BamTools is a toolkit for handling BAM files. BamTools provides a powerful suite of command-lines programs for manipulating and querying BAM files for data.
In particular we added the command bamtools stats, which prints general alignment statistics from the BAM file.