nf-core/hicar
Pipeline for HiCAR data, a robust and sensitive multi-omic co-assay for simultaneous measurement of transcriptome, chromatin accessibility and cis-regulatory chromatin contacts.
Introduction
This document describes the output produced by the pipeline. Most of the plots are taken from the MultiQC report, which summarises results at the end of the pipeline.
The directories listed below will be created in the results directory after the pipeline has finished. All paths are relative to the top-level results directory.
Pipeline overview
The pipeline is built using Nextflow and processes data using the following steps:
- FastQC - Raw read QC
- MultiQC - Aggregate report describing results and QC from the whole pipeline
- Pipeline information - Report metrics generated during the workflow execution
- genome - The genome related files used in the pipeline.
- checksums - The checksums (md5) of decompressed fastq files.
- bwa - The alignments of trimmed reads.
- pairs - The interaction pairs and their quality control reports.
- cooler - Cooler files for visualization
- ATACpeak - The peaks called for ATAC reads (R2 reads).
- MAPSpeak - The chromatin interactions determined by MAPS.
- DifferentialAnalyis - Differential analysis for chromatin interactions.
- fragmentPeak - The peaks called for R1 reads.
- HiCARpeak - The high resolution loops called for R1 and R2 peaks for motif analysis.
- circos - The circos plots.
- igv.js - The track files which can be viewed by web-server.
FastQC
Output files
fastqc/*_fastqc.html: FastQC report containing quality metrics.*_fastqc.zip: Zip archive containing the FastQC report, tab-delimited data file and plot images.
FastQC gives general quality metrics about your sequenced reads. It provides information about the quality score distribution across your reads, per base sequence content (%A/T/G/C), adapter contamination and overrepresented sequences. For further reading and documentation see the FastQC help pages.
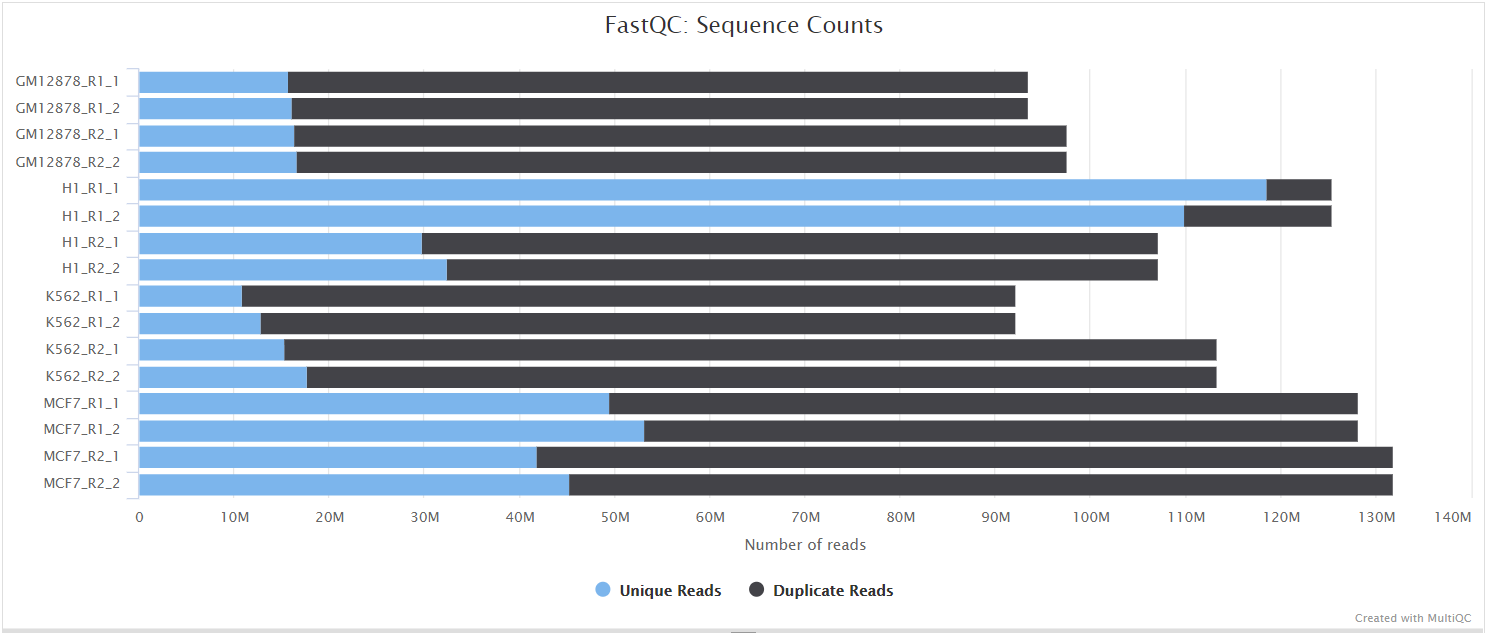
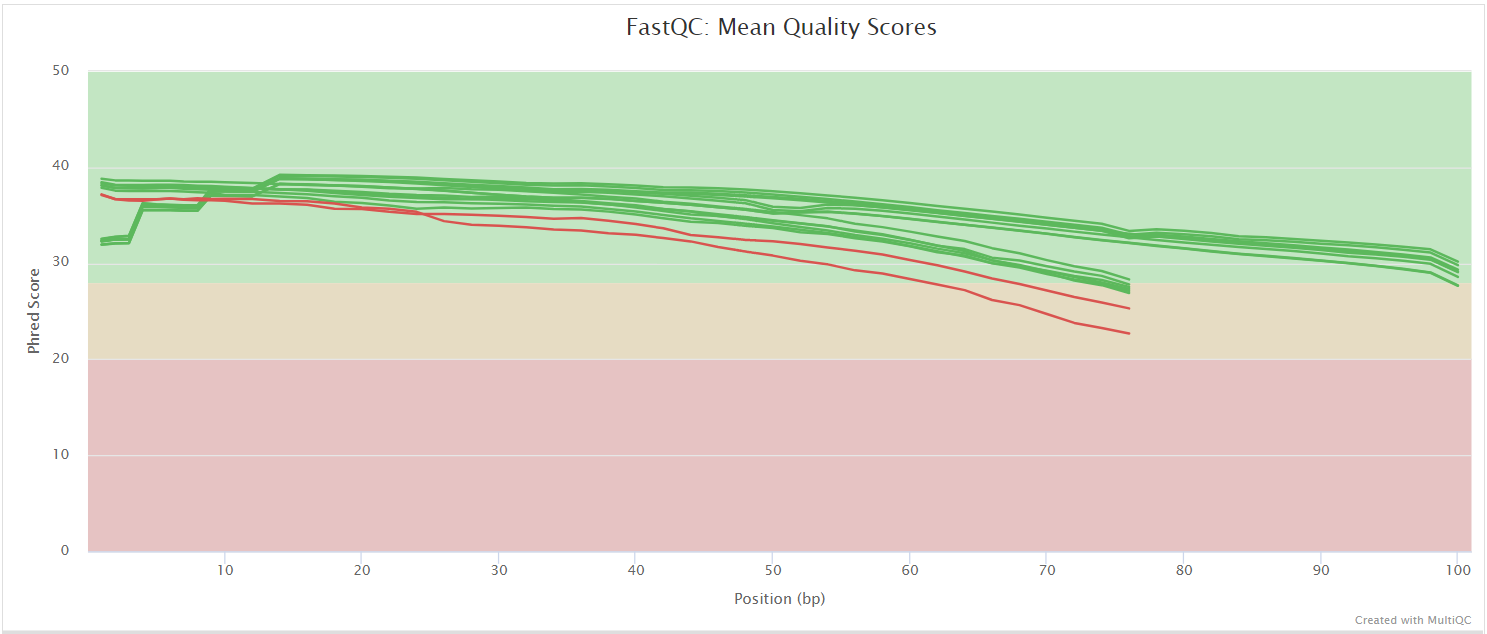
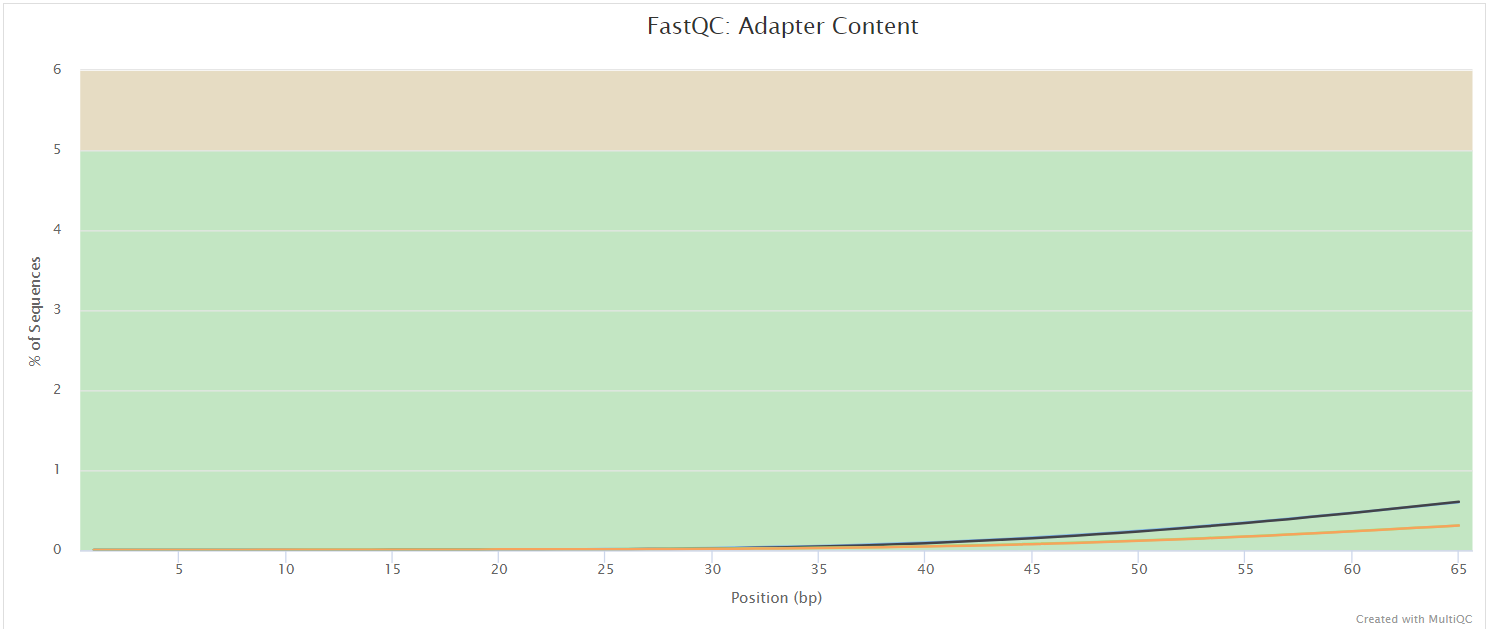
NB: The FastQC plots displayed in the MultiQC report shows untrimmed reads. They may contain adapter sequence and potentially regions with low quality.
MultiQC
Output files
multiqc/multiqc_report.html: a standalone HTML file that can be viewed in your web browser.multiqc_data/: directory containing parsed statistics from the different tools used in the pipeline.multiqc_plots/: directory containing static images from the report in various formats.
MultiQC is a visualization tool that generates a single HTML report summarising all samples in your project. Most of the pipeline QC results are visualised in the report and further statistics are available in the report data directory.
Results generated by MultiQC collate pipeline QC from supported tools e.g. FastQC. The pipeline has special steps which also allow the software versions to be reported in the MultiQC output for future traceability. For more information about how to use MultiQC reports, see http://multiqc.info.
Pipeline information
Output files
pipeline_info/- Reports generated by Nextflow:
execution_report.html,execution_timeline.html,execution_trace.txtandpipeline_dag.dot/pipeline_dag.svg. - Reports generated by the pipeline:
pipeline_report.html,pipeline_report.txtandsoftware_versions.yml. Thepipeline_report*files will only be present if the--email/--email_on_failparameter’s are used when running the pipeline. - Reformatted samplesheet files used as input to the pipeline:
samplesheet.valid.csv.
- Reports generated by Nextflow:
Nextflow provides excellent functionality for generating various reports relevant to the running and execution of the pipeline. This will allow you to troubleshoot errors with the running of the pipeline, and also provide you with other information such as launch commands, run times and resource usage.
checksums
Output files
checksums/*.txt: md5 checksums.
The md5 checksums of decompressed fastq files. This information can be used for GEO submission.
Genome
Output files
genome/genome.fa.sizes: chromosome sizes filegenome.fa.fai: genome index filefiltered/genome.include_regions.bed: filtered genome by blacklistdigest/*: genomic features files digested by given restriction enzyme
If the mappability file is not provided in the profile file, the GenMap will be used to create the mappability file with read length set to 50.
Alignment
Output files
bwa/mapped/bam/*.(bam|bai): The files resulting from the alignment of individual libraries will contain the coordinate sorted alignment files in*.bamformat.bwa/mapped/QC/*: The stats of mapping results.
Adapter-trimmed reads are mapped to the reference assembly using BWA::mem. A genome index is required to run BWA so if this is not provided explicitly using the --bwa_index parameter then it will be created automatically from the genome fasta input. The index creation process can take a while for larger genomes.
Pairs
Output files
pairs/raw/*: The raw reads pairs for each sample and stats for the pairs.filtered/*: The filtered files in hdf5 format. The hdf5 files in the folder can be used to generate virtual 4C plots.QC/*: The quality analysis results.
The raw and filtered pairs exported by pairtools. The quality analysis for filtered pairs were done by pairsqc.
The hdf5 filtered pairs contains following groups:
header/, including total reads, chromosome name and sizes, tile width for index.header/chrom_sizes, COMPOUNDheader/header, STRINGheader/tile_width, INTEGERheader/total, INTEGER
data/, pairs in pathdata/chr1_for_R1_reads/chr2_for_R2_reads/tileIndex1_tileIndex2/, the tile index is calculated by the ceiling of posistion divided by tile width.position, genomic location saved in pathdata/chr1/chr2/tileIndex1_tileIndex2/positionstrand, strand info saved inpath data/chr1/chr2/tileIndex1_tileIndex2/strand
Cooler
Output files
cooler/mcool/*: The mcool files for each group.cooler/hic/*: The .hic files for each group.cooler/MAPS/*: The mcool and .hic files normalized by MAPS fitting model for each group.
Cooler files for visualization.
To view the .mcool files, you may want to try higlass-manage.
Once higlass-manage is installed, view the files using the command:
higlass-manage view cooler/mcool/your.mcoolJuicebox can be used to view the .hic file.
Visualizing the .hic file with Juicebox is an alternative when higlass-manage is not available.
Call peaks for R2 reads
Output files
ATACpeak/R2_bigwig/*: The bigWig files of R2_reads.peaks_per_Group/*: The called peaks for each group.merged_peaks/*: The merged peaks for all groups.
The peaks called ATAC reads (R2 reads) by MACS2.
Different from ATAC-seq peak calling, the ATAC reads in HiCAR is single end.
By default, the peaks are called by --no-model parameter for the R2 reads in BED format.
Chromatin interactions
Output files
MAPSpeak/bin*/*: The annotated TADs and loops.*: The tables of chromatin interactions with p-value and fdr.
The chromatin interactions are called by MAPS.
MAPS is a model-based analysis of long-range chromatin interactions for AND or XOR reads.
ANDset: bin pairs withbothends overlapping two anchors of interaction.XORset: bin pairs with one end overlapping one anchor of the interaction.
It will remove the systematic bias by accessibility.
By default, the interactions are called by positive poisson regression model
and then filtered by coverage (default is 12 per bin), fold change (default is 2 times over expected value) and fdr (default is 0.01).
Differential analysis
Output files
DifferentialAnalysis/*: Differential analysis results.
Differential analysis for the loops by edgeR. The input counts are filtered counts dumped by pairtools for each samples. The differential analysis is done for validated chromatin interactions by MAPs. Annotation is done by ChIPpeakAnno for the overlap features (gene level) or nearest features.
Call peaks for fragment reads
Output files
fragmentPeak/R1_bigwig/byGroup/*: The bigWig files of R1_reads for each group.pos1/*: The bigWig files of 5’ ends of R1_reads.
merged_peaks/merged_peak.bed: The bed file with merged R1 peaks from all samples.peaks_per_Group/*: The MACS2 output for each group.
The peaks called fragment (R1) reads by fitting the reads counts in fragmentation sites with Poisson distribution. The fragment reads will be more noisy compare to ATAC (R2) reads and the p value cutoff will be higher to get proper peaks for interaction calling.
High resolution interactions
Output files
HiPeakdistalpair_in_peak_bams_4_igv/*: The psuedo-bam file for visualization.*/: The high resolution interactions in bedpe format and tab delimited format.
The HiCAR fastq files are paired ends (PE). But it will be difficult to check the reads in pairs for IGV.
In order to view the reads located in the R1 and R2 peaks, the psuedo-bam files are created by adding insertion to the PE and converted as single ends.
When the psuedo-bam file is load to IGV, the PEs will be linked by a line, which will help user to double check the reads located in the chromation interactions.
The high resolution chromatin interactions (HiPeak) are called by similar methods like MAPS to remove the systematic bias by accessibility.
The difference is that HiPeak will also consider the trans-interactions.
The output of HiPeak is designed for motif enrichment analysis.
circos
Output files
circos/*: circos plots.
circos is a perl package for visualizing data in a circular layout. circos is used to produce the genomic view of chromatin interactions for HiPeak.
IGV
Output files
igv.js/*: index.html, readme.txt and track_files.txt.
The track.txt contain the reads tracks and interactions called by MAPS. Copy all the files into a web-server to view the data vis igv.js.