nf-core/imcyto
Image Mass Cytometry analysis pipeline
22.10.6.
Learn more.
Output
Pipeline overview
The pipeline is built using Nextflow. See main README.md for a condensed overview of the steps in the pipeline, and the bioinformatics tools used at each step.
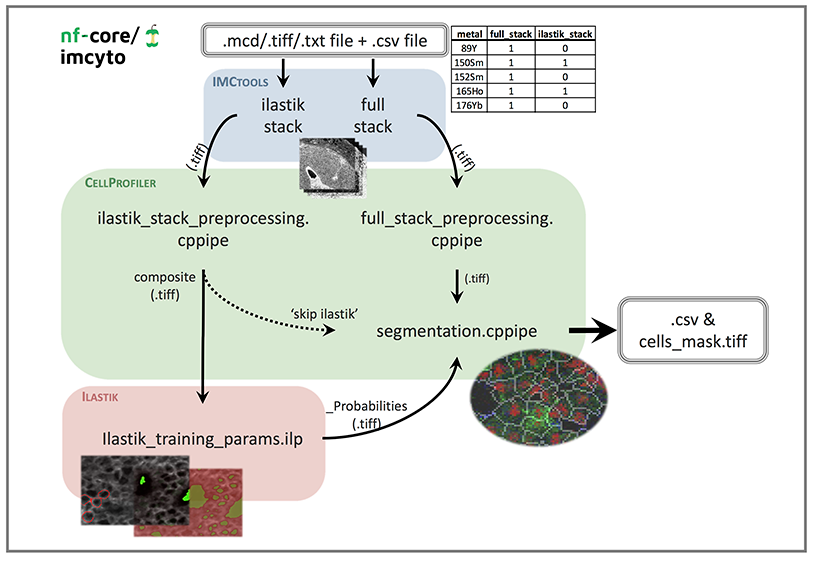
This is an automated image analysis pipeline that sequentially pre-processes and single cell segments imaging data to extract single cell expression data. This pipeline was generated for Imaging Mass Cytometry experiments, however, it is flexible enough to be applicable to other types of imaging data (e.g. immunofluorescence/immunohistochemistry data).
The input to the pipeline can be in either mcd, tiff or txt file format from which stacks of tiff files are generated for subsequent analysis. The various stages of this pipeline allow the tiff images to be pre-processed, and segmented using multiple CellProfiler cppipe project files and the pixel-classification software Ilastik. The concept of this step-wise image segmentation by combining Ilastik with CellProfiler was based on the analysis pipeline as described by the Bodenmiller group (Zanotelli & Bodenmiller, Jan 2019).
The project files supplied with the pipeline constitute the minimal requirements to generate a single cell mask. A more refined and comprehensive pipeline will be uploaded in due course.
This pipeline is designed to run on most compute infrastructures without the need to pre-install any of the software packages. However, in order to initially create the custom plugin files required by the pipeline, one needs to install the latest GUI versions of CellProfiler and Ilastik on a local machine (see Customising inputs).
Pipeline schematic
File prerequisites
-
mcd,tiffortxtdata file(s) without any spaces in the file names. Associated antibody panel should contain metal and antibody information in the form of “metal_antibody” e.g. “89Y_CD45”. -
metadata.csvfile containing your antibody panel to identify whichtifffiles are to be used for the full and Ilastik stacks. See--metadata.csvfor the required file format. -
CellProfiler
cppipefiles with the “NamesAndTypes” module edited to match your antibody panel and desired markers for the identification of cell nuclei and membranes (see Customising inputs). Other recommended changes to the pipeline are outlined in the Pipeline details section.
Customising inputs
-
To view, edit and create the
cppipefiles required by the pipeline you will have to download and install the CellProfiler GUI locally. Custom CellProfiler plugins created by the Bodenmiller group (e.gsmoothmultichannel.pyandmeasureobjectintensitymultichannel.py) can be found here. You can also create and use you own custom plugins. Open “CellProfiler > Preferences” and change the “CellProfiler plugins directory” path to where you have stored the custom plugins. When saving the editedcppipefiles, make sure to export the file as acppipe. If you would like to follow the naming convention in the schematic above you can name the files as eitherfull_stack_preprocessing.cppipe,ilastik_stack_preprocessing.cppipeorsegmentation.cppipe. -
If you use a custom module in any of the CellProfiler
cppipefiles make sure to also add it to theplugins/directory you will be supplying to the pipeline via the--pluginsparameter (see Pipeline execution). -
The pipeline uses a test-dataset that comes with a pre-trained Ilastik pixel classifier, however if you would like to train a classifier using your own dataset then you will have to download and install Ilastik. The input image should be generated by using
ilastik_stack_preprocessing.cppipewith CellProfiler. The desired composite RGB images can be provided intiffformat and you can use “membrane”, “nuclei” and “background” labels to train your classifier. When exporting, select source as “Probabilities”, transpose axis order to “cyx” and export output file as “tiff sequence” to generate the appropriate probability maps. If you would like to follow the naming convention in the schematic above you can name the fileilastik_training_params.ilp. -
The pipeline has an optional
--skip_ilastikparameter which allows the Ilastik pixel classification step to be bypassed in favour of executing a CellProfiler only pipeline. In this case, the--ilastik_training_ilpparameter doesnt have to be provided, and images that have been pre-processed throughilastik_stack_preprocessing.cppipewill be directly passed to thesegmentation.cppipe, therefore bypassing Ilastik. This approach might be preferred if CellProfiler alone is deemed sufficient to achieve a reliable segmentation mask. -
The pipeline has an optional
--compensation_tiffparameter if you wish to apply a pre-determined spillover compensation function or illumination function to images during one or both of the full stack and Ilastik stack pre-processing steps. Examples of compensation might include: illumination correction to microscopy images or spillover compensation for Imaging Mass Cytometry data.
Pipeline execution
Once you have created/obtained the files required to run the pipeline, the directory structure may look like the listing below:
.
├── inputs
│   ├── metadata.csv
│   └── sample_name.mcd
└── plugins
    ├── cp_plugins
    │   ├── measureobjectintensitymultichannel.py
    │   └── smoothmultichannel.py
    ├── full_stack_preprocessing.cppipe
    ├── ilastik_stack_preprocessing.cppipe
    ├── ilastik_training_params.ilp
    └── segmentation.cppipe
Providing you have installed the version of Nextflow required by the pipeline, and you either have Docker or Singularity installed and available on the PATH, you can then execute the pipeline on your compute infrastructure using the command below:
nextflow run nf-core/imcyto \
    --input "./inputs/*.mcd" \
    --metadata './inputs/metadata.csv' \
    --full_stack_cppipe './plugins/full_stack_preprocessing.cppipe' \
    --ilastik_stack_cppipe './plugins/ilastik_stack_preprocessing.cppipe' \
    --ilastik_training_ilp './plugins/ilastik_training_params.ilp' \
    --segmentation_cppipe './plugins/segmentation.cppipe' \
    --plugins './plugins/cp_plugins/' \
    -profile <docker/singularity/institute>
Nextflow will automatically download the pipeline and its associated software containers in order to execute the pipeline. See Adding your own cluster configuration for tips on how to customise the pipeline execution for your compute infrastructure.
Inputs/outputs
Each step of the pipeline as depicted in the pipeline schematic is broken down and explained below, with the inputs and outputs highlighted. The directories listed below will be created in the output directory after the pipeline has finished. All paths are relative to the top-level results/ directory.
1. imctools
Input files:
mcd,tiffortxtfilemetadata.csvfile
Output files:
imctools/<SAMPLE>/*.csvimctools/<SAMPLE>/<ROI>/full_stack/*.tiffimctools/<SAMPLE>/<ROI>/full_stack.ome.tiffimctools/<SAMPLE>/<ROI>/ilastik_stack/*.tiffimctools/<SAMPLE>/<ROI>/ilastik_stack.ome.tiff
Description:
- Parse data files for ROI information and convert each channel into individual
tifffiles. - Uses
metadata.csvto sorttifffiles into corresponding folders i.e.full_stack/orilastik_stack/.
2. Pre-process full stack
Input files:
- Full stack of
tiffimages generated by imctools step
Output files:
preprocess/<SAMPLE>/<ROI>/full_stack/*.tiff
Description:
- This step selects all images in
full_stackfolder and sequentially processes them through various filtering methods, including removal of hot pixels and median filtering, and then saves all files. - These image filtering parameters can be changed by opening and customising the
cppipefile in CellProfiler. - To keep your data raw, uncheck all the modules except “SaveImages”. This will simply re-save the unchanged input images into the correct place for the next step in the pipeline.
- Make sure to export a
cppipefile.
3. Pre-process Ilastik stack
Input files:
- Ilastik stack of
tiffimages generated by imctools step
Output files:
preprocess/<SAMPLE>/<ROI>/ilastik_stack/composite.tiff
Description:
- This step first selects specific files by finding matching names and labels them as either “membrane” and “nuclei”. These images are then filtered and merged to create an RGB composite image, which is saved as
composite.tiff. - Open
cppipefile in CellProfiler to change names of input images in “NamesAndTypes”. Select markers that are representative of total cell plasma membranes and cell nuclei. If one marker does not cover all cell type membranes, then various membrane markers can be merged by adding in an “ImageMath” module to create a total membrane image, this image will need to be titled “membrane”. - Further parameters can be customised, such as the filtering methods and parameters.
- Make sure to export a
cppipefile.
4. Ilastik
Input files:
composite.tiffgenerated by Pre-process Ilastik stack step.
Output files:
ilastik/<SAMPLE>/<ROI>/composite_Probabilities_0.tiff(membrane)ilastik/<SAMPLE>/<ROI>/composite_Probabilities_1.tiff(nuclei)ilastik/<SAMPLE>/<ROI>/composite_Probabilities_2.tiff(background)
Description:
- Pixels are classified into three sets: membrane, nuclei and background by Ilastik using a pre-trained pixel classifier to generate and save a probability map of each.
- If required, the Ilastik classifier can be retrained using a new dataset. These inputs should be the output composite image of the
ilastik_stack_preprocessingstep. When selecting export settings, select source as “Probabilties”, transpose axis order to “cyx” and export output file as “tiff sequence” to generate probability maps. - Make sure to save ilastik classifier as “ilastik_training_params.ilp”.
- The
--skip_ilastikparameter can be used to skip the Ilastik pixel classification altogether. In this case, the--ilastik_training_ilpparameter doesnt need to be provided, and images that have been pre-processed through theilastik_stack_preprocessing.cppipewill be directly passed to thesegmentation.cppipe, therefore bypassing Ilastik.
5. Segmentation
Input files:
- pre-processed full_stack of .tiff images generated by full_stack_preprocessing step and composite_Probabilities_ generated by Ilastik or composite.tiff if Ilastik is skipped.
Output files:
segmentation/<SAMPLE>/<ROI>/Cells.csvsegmentation/<SAMPLE>/<ROI>/Cells_mask.tiff
Description:
- Open .cppipe file in CellProfiler to change names of input images in ‘NamesAndTypes’ to match your antibody panel, making sure to keep “_Probabilities_0” as prob_membrane and “_Probabilities_2” as prob_background.
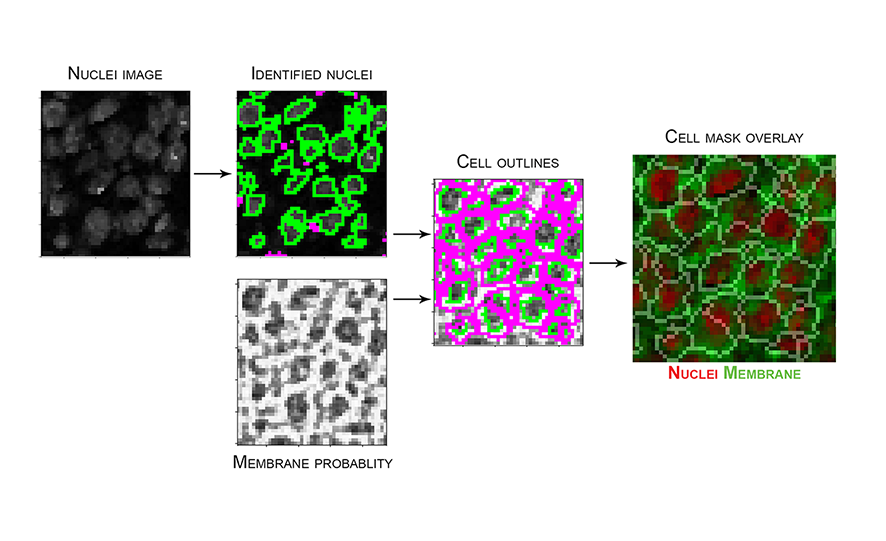
- Currently, this process uses the nuclear image to identify nuclei as primary objects, subtracts background probability from the membrane probability image and then uses both identified nuclei and membrane probability to identify whole cells as secondary objects. These cell objects are then converted into a uint16 image to generate the cell mask and saved. The cell mask is then used to measure size and shape information of all cell objects, and extract single cell expression data.
- You may need to adapt parameters present in “IdentifyPrimaryObjects” and “IdentifySecondaryObjects” modules to best suit your data. Common changes include typical diameter size in pixels of nuclear objects, thresholding strategy and method to distinguish clumped objects. Alternatively, one can opt for using the nuclei probability output (“_Probabilities_1”) from Ilastik to identify the nuclei as primary objects.
- Within “MeasureObjectIntensity Multichannel” you will need to select all the images that you would like the intensity to be measured for.
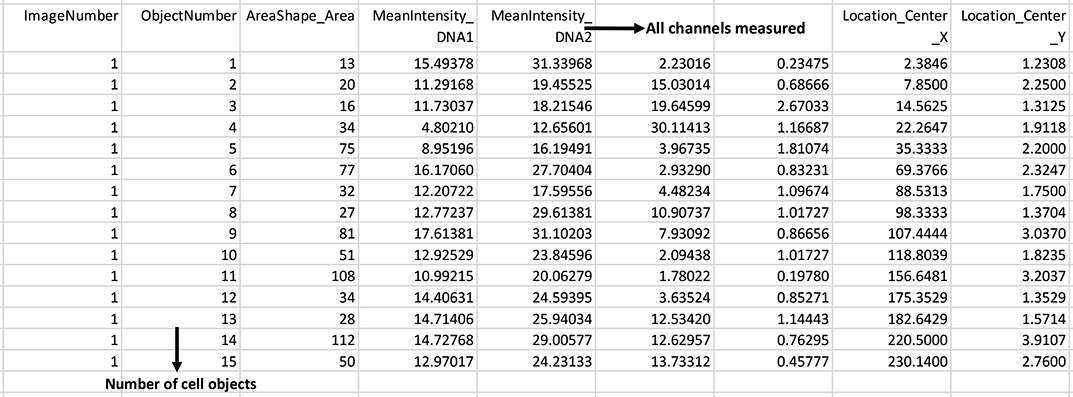
- Further parameters can be customised, such as the desired measurements to export in “ExportToSpreadsheet”. Currently this pipeline exports data only for each cell object: area, mean intensity, object center location and object number.
- Make sure to export a
cppipefile. - Image below represents an example of the steps in
segmentation.cppipe, with nuclei image input fromfull_stack_preprocessingand membrane probability input from Ilastik, to generate the resulting cell mask. Mask overlay image created in HistoCAT with nuclei and membrane channels coloured in red and green, respectively.
6. Pipeline reporting
Output files:
pipeline_info/- Reports generated by the pipeline -
pipeline_report.html,pipeline_report.txtandsoftware_versions.csv. - Reports generated by Nextflow -
execution_report.html,execution_timeline.html,execution_trace.txtandpipeline_dag.svg.
- Reports generated by the pipeline -
Documentation/- Documentation for interpretation of results in HTML format -
results_description.html.
- Documentation for interpretation of results in HTML format -
Description:
- Nextflow provides excellent functionality for generating various reports relevant to the running and execution of the pipeline. This will allow you to trouble-shoot errors with the running of the pipeline, and also provide you with other information such as launch commands, run times and resource usage.
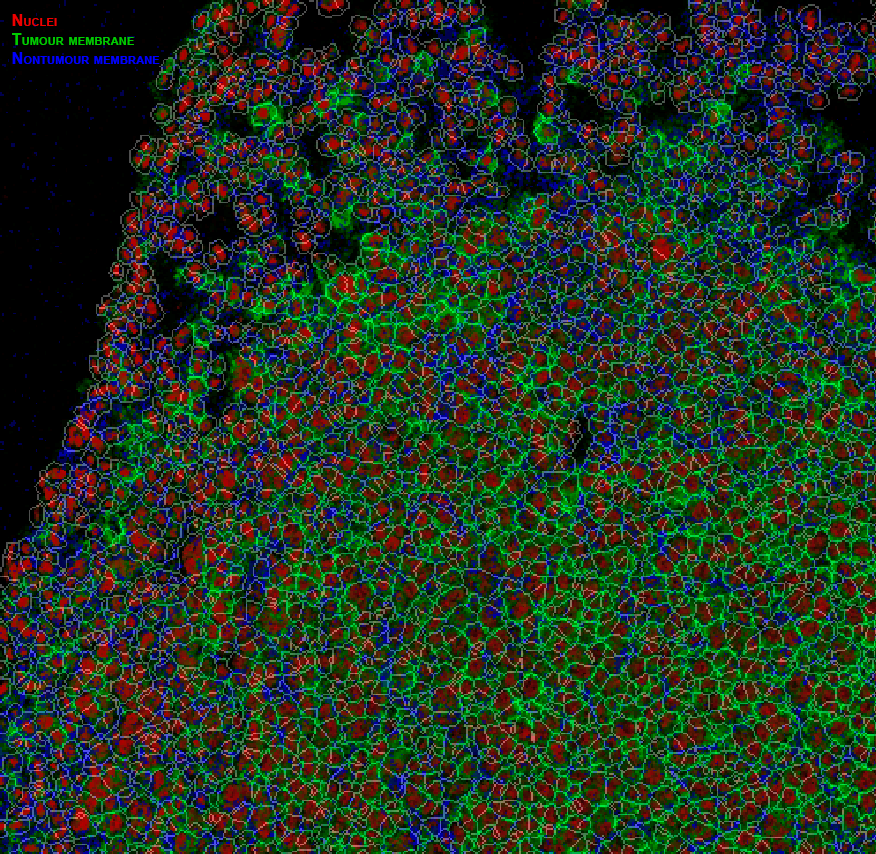
Example pipeline output
Cell mask overlay image created in HistoCAT with nuclei, tumour cells and non-tumour cell channels coloured in red, green and blue, respectively.
Output csv file containing each cell object and measured mean intensities:
Common errors and solutions
When there are errors with the execution of the pipeline, the pipeline log will tell you exactly which process has caused the error, the command output and the command error, as well as the path to a unique directory (e.g. work/00/c7ac5c89d10e234abaf25b2213634b) where the process would have been executed.
If the pipeline fails to run, in the first instance try to re-run it with the addition of the
-resumeparameter
Channel naming
Command output: CP-JAVA 15:04:54.326 [Thread-0] WARN  o.c.imageset.ChannelFilter - Channels have different numbers of images
Command error: ... Error for image set, channel=1, metadata=CD4: Image missing from channel
Check the images chosen in metadata.csv match the names chosen in the CellProfiler “NamesandTypes” modules. Make sure all metal names are correct and unambiguous (e.g. CD4 will find both CD4 and CD44 in “NamesandTypes”).
Missing output files
Caused by: Missing output file(s) 'ilastik_stack/*' expected by process 'PreprocessIlastikStack (file_name_roi_1)'Reopen the corresponding CellProfiler cppipe file and check that the “SaveImages” module is set to give the correct output, re-export this and re-run the pipeline by using the -resume parameter.
ROI size
For ROIs larger than ~2000-2000um the pipeline may struggle/fail to complete due to the excessive memory requirements during the “IdentifyObjects” module in segmentation.cppipe. As a workaround for this we recommend adding in a “Crop” module before identifying objects to crop your images into two. Make sure to duplicate any subsequent modules and adjust input names as required.
Related software
-
The MCD Viewer software provided by the Hyperion imaging system allows users to visualise, review and export
mcdimage files. -
Fiji-ImageJ can be used to view
mcdfiles but requires downloading the imctools plugin. This plugin allows themcdfile to be viewed as an image5D with your antibody markers as individual channels that can be toggled on/off. -
QuPath can be used for visualisation with the added benefit of viewing all channels at once in a mini viewer panel.
-
HistoCAT developed by the Bodenmiller lab enables visualisation of images and contains various analysis tools including PhenoGraph, tSNE, PCA and Neighbourhood analysis.