nf-core/methylseq
Methylation (Bisulfite-Sequencing) analysis pipeline using Bismark/bwa-meth + MethylDackel or bwa-mem + rastair
Introduction
This document describes the output produced by the methylseq pipeline.
Most of the plots are taken from the MultiQC report, which summarizes results at the end of the pipeline.
NOTE: nf-core/methylseq contains three alignment workflows - one for Bismark, one for bwa-meth and one for bwa-mem. On top of that, there is an extra workflow to process conversion rates from TAPS data (protocol for positive methylation reading) through Rastair. The results files produced will vary depending on which variant is run.
The output directories listed below will be created in the results directory after the pipeline has finished. All paths are relative to the top-level results directory.
Pipeline overview
The pipeline is built using Nextflow and processes data using the following steps:
- FastQC - Raw read QC
- TrimGalore - Adapter trimming
- Alignment - Aligning reads to reference genome
- Deduplication - Deduplicating reads
- Methylation Extraction - Calling cytosine methylation steps
- Bismark Reports - Single-sample and summary analysis reports
- Qualimap - Tool for genome alignments QC [OPTIONAL]
- Preseq - Tool for estimating sample complexity [OPTIONAL]
- HS Metrics - Assessing performance on target-capture sequencing experiments [OPTIONAL]
- Reference Genome Preparation - Preparing indices for alignment [OPTIONAL]
- MultiQC - Aggregate report describing results and QC from the whole pipeline
- Pipeline information - Report metrics generated during the workflow execution
Example output directories of nf-core/methylseq -test profile run
Bismark
bismark/
├── bismark
│   ├── alignments
│   ├── deduplicated
│   ├── methylation_calls
│   ├── reports
│   └── summary
├── fastqc
│   ├── Ecoli_10K_methylated_1_fastqc.html
│   ├── Ecoli_10K_methylated_2_fastqc.html
│   └── zips
├── multiqc
│   └── bismark
├── pipeline_info
│   ├── execution_report_2024-12-13_05-38-05.html
│   ├── execution_timeline_2024-12-13_05-38-05.html
│   ├── execution_trace_2024-12-13_05-38-05.txt
│   ├── nf_core_methylseq_software_mqc_versions.yml
│   ├── params_2024-12-13_05-38-14.json
│   └── pipeline_dag_2024-12-13_05-38-05.html
└── trimgalore
    ├── fastqc
    └── logs
bwa-meth
bwameth/
├── bwameth
│   ├── alignments
│   └── deduplicated
├── fastqc
│   ├── Ecoli_10K_methylated_1_fastqc.html
│   ├── Ecoli_10K_methylated_2_fastqc.html
│   └── zips
├── methyldackel
│   ├── Ecoli_10K_methylated.markdup.sorted_CpG.bedGraph
│   └── mbias
├── multiqc
│   └── bwameth
├── pipeline_info
│   ├── execution_report_2024-12-13_05-36-34.html
│   ├── execution_timeline_2024-12-13_05-36-34.html
│   ├── execution_trace_2024-12-13_05-36-34.txt
│   ├── nf_core_methylseq_software_mqc_versions.yml
│   ├── params_2024-12-13_05-36-43.json
│   └── pipeline_dag_2024-12-13_05-36-34.html
└── trimgalore
    ├── fastqc
    └── logs
bwa-mem
bwamem/
├── bwamem
│   ├── alignments
│   │   └── samtools_stats
│   └── deduplicated
│       └── picard_metrics
├── fastqc
│   ├── Ecoli_10K_methylated_1_fastqc.html
│   ├── Ecoli_10K_methylated_2_fastqc.html
│   └── zips
├── multiqc
│   └── bwamem
├── pipeline_info
│   ├── execution_report_2024-12-13_05-36-34.html
│   ├── execution_timeline_2024-12-13_05-36-34.html
│   ├── execution_trace_2024-12-13_05-36-34.txt
│   ├── nf_core_methylseq_software_mqc_versions.yml
│   ├── params_2024-12-13_05-36-43.json
│   └── pipeline_dag_2024-12-13_05-36-34.html
├── rastair
│   ├── call
│   │   └── Ecoli_10K_methylated.rastair_call.txt
│   ├── mbias
│   │   └── Ecoli_10K_methylated.rastair_mbias.txt
│   ├── mbiasparser
│   │   └── Ecoli_10K_methylated.rastair_mbias_processed.csv
│   └── methylkit
│       └── Ecoli_10K_methylated.rastair_methylkit.txt.gz
└── trimgalore
    ├── fastqc
    └── logs
Detailed Output Descriptions
Reference Genome Preparation
If you provide a FASTA file as input (--fasta), the pipeline will automatically generate the necessary reference genome files for your chosen aligner. These files are saved in the results directory.
Output directory: results/<aligner>/reference_genome/
- This directory contains the aligner-specific index files. For Bismark, this will be a
BismarkIndex/directory. For bwa-meth, this will be aBwamethIndex/directory.
NB: These files are only generated if a FASTA file is provided as input and
--save_referenceis specified.
FastQC
Output files
fastqc/*_fastqc.html: FastQC report containing quality metrics.*_fastqc.zip: Zip archive containing the FastQC report, tab-delimited data file and plot images.
FastQC gives general quality metrics about your sequenced reads. It provides information about the quality score distribution across your reads, per base sequence content (%A/T/G/C), adapter contamination and overrepresented sequences. For further reading and documentation see the FastQC help pages.
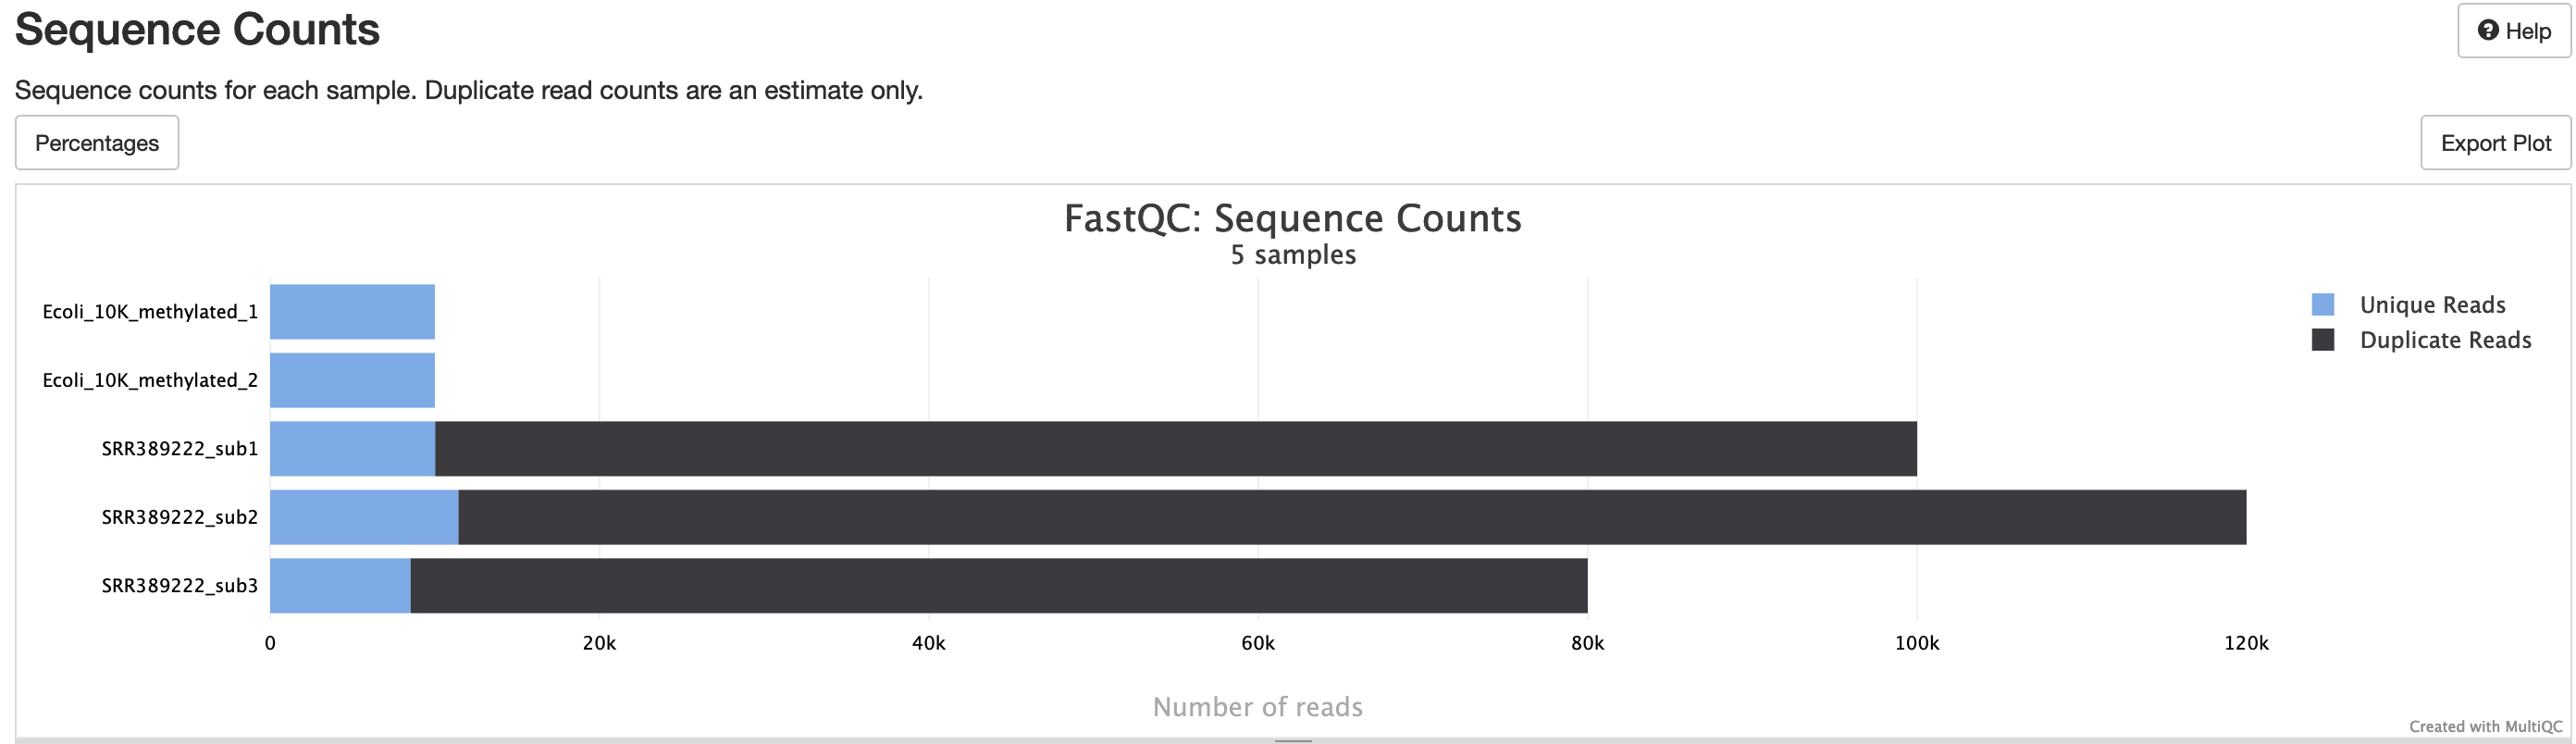
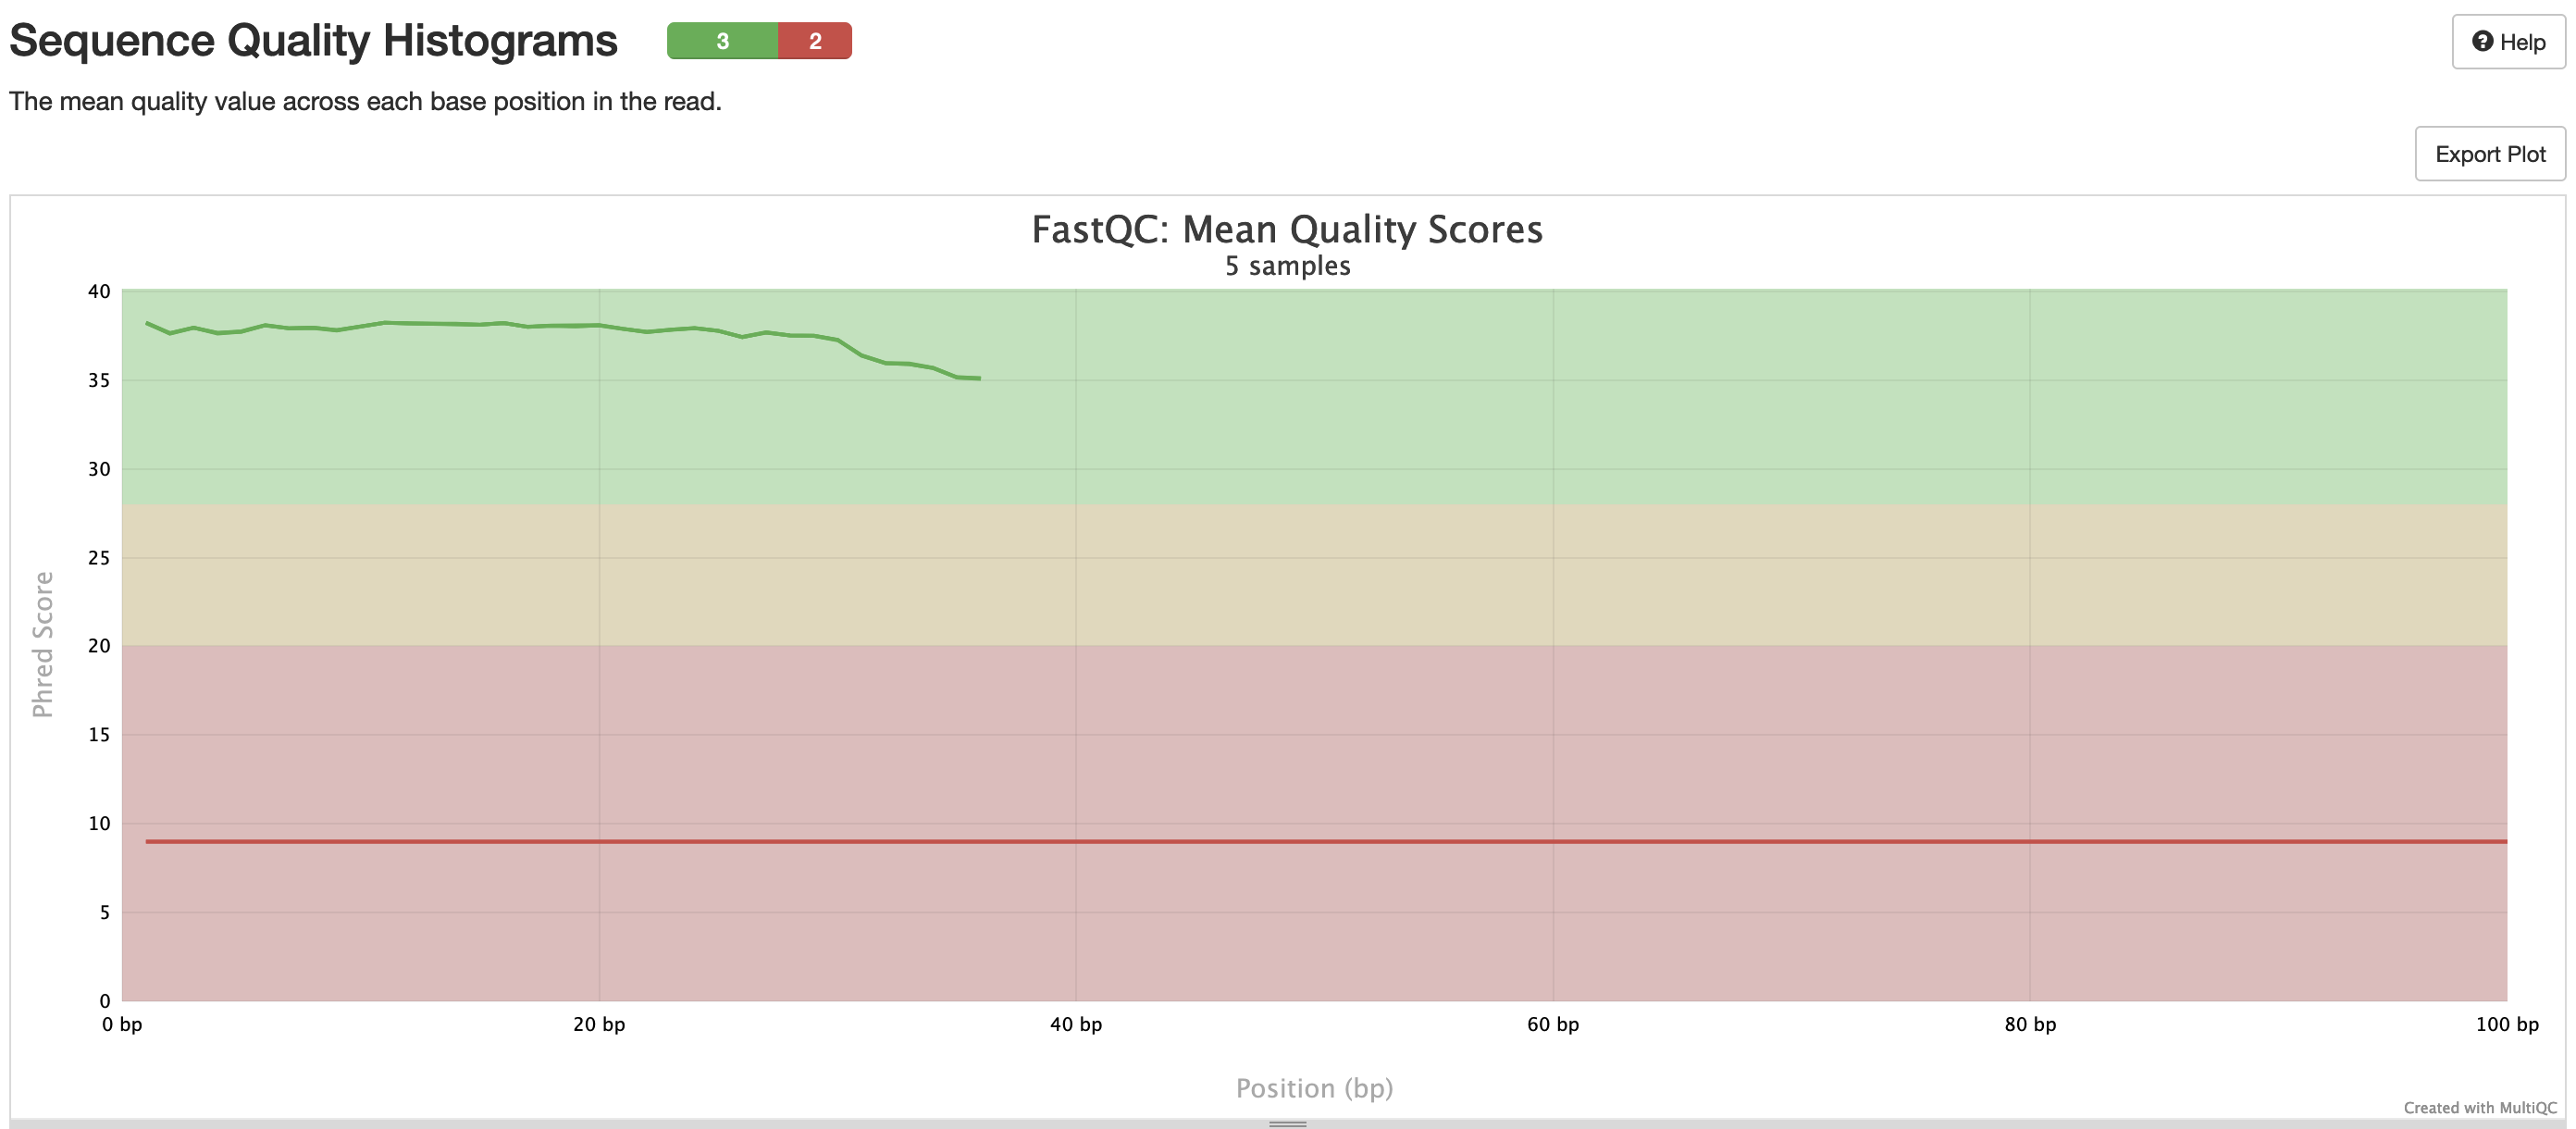
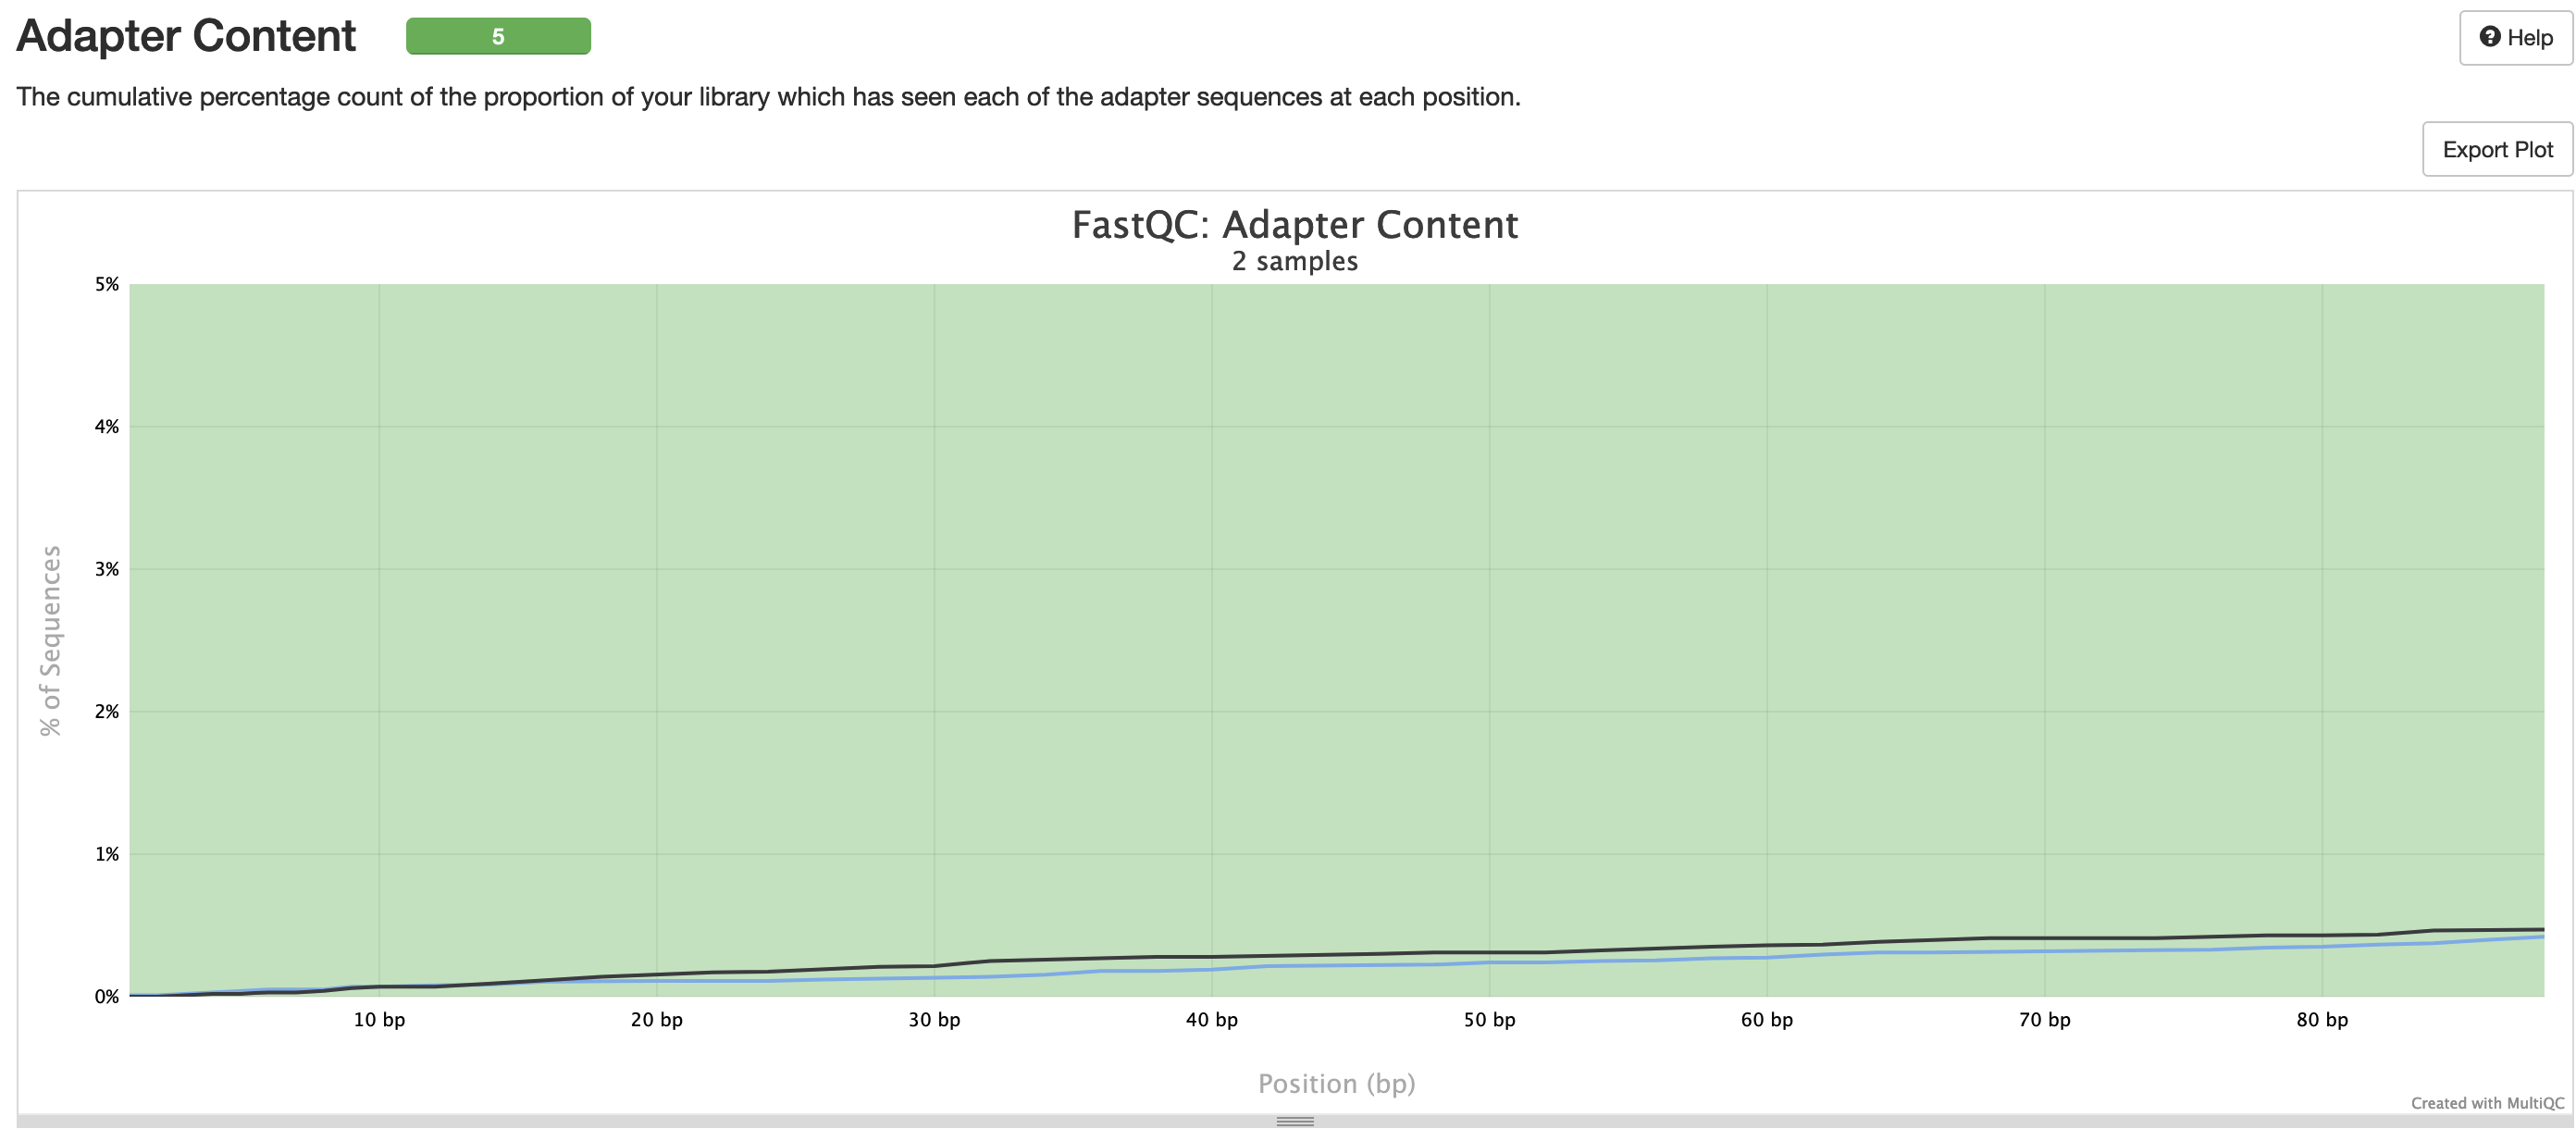
NB: The FastQC plots in this directory are generated relative to the raw, input reads. They may contain adapter sequence and regions of low quality. To see how your reads look after adapter and quality trimming please refer to the FastQC reports in the trimgalore/fastqc/ directory.
FastQC gives general quality metrics about your sequenced reads. It provides information about the quality score distribution across your reads, per base sequence content (%A/T/G/C), adapter contamination and overrepresented sequences. For further reading and documentation see the FastQC help pages.
TrimGalore
The nf-core/methylseq pipeline uses TrimGalore! for removal of adapter contamination and trimming of low quality regions. TrimGalore is a wrapper around Cutadapt and runs FastQC after it finishes.
MultiQC reports the percentage of bases removed by Cutadapt in the General Statistics table, along with a line plot showing where reads were trimmed.
Output directory: results/trimgalore
Contains FastQ files with quality and adapter trimmed reads for each sample, along with a log file describing the trimming.
sample_val_1.fq.gz,sample_val_2.fq.gz- Trimmed FastQ data, reads 1 and 2.
- NB: Only saved if
--save_trimmedhas been specified.
logs/sample_val_1.fq.gz_trimming_report.txt- Trimming report (describes which parameters that were used)
fastQC/sample_val_1_fastqc.zip- FastQC report for trimmed reads
Single-end data will have slightly different file names and only one FastQ file per sample.
Alignment
Bismark and bwa-meth convert all Cytosines contained within the sequenced reads to Thymine in-silico and then align against a three-letter reference genome. This method avoids methylation-specific alignment bias. The alignment produces a BAM file of genomic alignments.
Bismark output directory: results/bismark/alignments/
Note that bismark can use either use Bowtie2 (default) or HISAT2 as alignment tool and the output file names will not differ between the options.
sample.bam- Aligned reads in BAM format.
- NB: Only saved if
--save_align_intermeds,--skip_deduplicationor--rrbsis specified when running the pipeline.
logs/sample_PE_report.txt- Log file giving summary statistics about alignment.
unmapped/unmapped_reads_1.fq.gz,unmapped/unmapped_reads_2.fq.gz- Unmapped reads in FastQ format.
- Only saved if
--unmappedspecified when running the pipeline.
bwa-meth output directory: results/bwameth/alignments/
sample.bam- Aligned reads in BAM format.
- NB: Only saved if
--save_align_intermedsis used
sample.sorted.bam- Aligned reads in a sorted BAM file.
- NB: Only saved if
--save_align_intermeds,--skip_deduplicationor--rrbsis specified when running the pipeline.
sample.sorted.bam.bai- Index of sorted BAM file
- NB: Only saved if
--save_align_intermeds,--skip_deduplicationor--rrbsis specified when running the pipeline.
logs/samtools_stats/sample_flagstat.txt- Summary file describing the number of reads which aligned in different ways.
logs/samtools_stats/sample_stats.txt- Summary file giving lots of metrics about the aligned BAM file.
bwa-mem output directory: results/bwamem/alignments/
sample.sorted.bam- Sorted aligned reads in BAM format.
- NB: Only saved if
--save_align_intermedsor--skip_deduplicationis specified.
sample.sorted.bam.bai- Index of sorted BAM file.
- NB: Only saved if
--save_align_intermedsor--skip_deduplicationis specified.
samtools_stats/sample.flagstat- Summary file describing the number of reads which aligned in different ways.
samtools_stats/sample.stats- Summary file giving lots of metrics about the aligned BAM file.
samtools_stats/sample.idxstats- Summary file with alignment statistics per reference sequence.
Deduplication
This step removes alignments with identical mapping position to avoid technical duplication in the results. Note that it is skipped if --save_align_intermeds, --skip_deduplication or --rrbs is specified when running the pipeline.
Bismark output directory: results/bismark/deduplicated/
deduplicated.bam- BAM file with only unique alignments.
logs/deduplication_report.txt- Log file giving summary statistics about deduplication.
bwa-meth output directory: results/bwameth/deduplicated/
NB: The bwa-meth step doesn’t remove duplicate reads from the BAM file, it just labels them.
sample.sorted.markDups.bam- BAM file with only unique alignments.
sample.sorted.markDups.bam.bai- Index for markDups BAM file.
logs/sample.sorted.markDups_metrics.txt- Log file giving summary statistics about deduplication.
bwa-mem output directory: results/bwamem/deduplicated/
sample.markdup.sorted.bam- Sorted BAM file with duplicated reads marked.
sample.markdup.sorted.bam.bai- Index for the markdup BAM file.
picard_metrics/sample.markdup.sorted.MarkDuplicates.metrics.txt- Log file giving summary statistics about deduplication.
Methylation Extraction
The methylation extractor step takes a BAM file with aligned reads and generates files containing cytosine methylation calls. It produces a few different output formats, described below.
Note that the output may vary a little depending on whether you specify --comprehensive, --non_directional, --all_contexts or --run_targeted_sequencing when running the pipeline.
Filename abbreviations stand for the following reference alignment strands:
OT- original top strandOB- original bottom strandCTOT- complementary to original top strandCTOB- complementary to original bottom strand
Bismark output directory: results/bismark/methylation_calls/
NB:
CTOTandCTOBare not aligned unless--non_directionalspecified.
methylation_calls/XXX_context_sample.txt.gz- Individual methylation calls, sorted into files according to cytosine context.
methylation_coverage/sample.bismark.cov.gz- Coverage text file summarising cytosine methylation values. Available only for CpG context.
bedGraph/sample.bedGraph.gz- Methylation statuses in bedGraph format, with 0-based genomic start and 1- based end coordinates. Available only for CpG context.
m-bias/sample.M-bias.txt- QC data showing methylation bias across read lengths. See the bismark documentation for more information.
logs/sample_splitting_report.txt- Log file giving summary statistics about methylation extraction.
bwa-meth workflow output directory: results/methyldackel/
NB:
CHGandCHHcontexts are not provided unless--all_contextsspecified.
sample.bedGraph- Methylation statuses in bedGraph format.
bwa-mem / TAPS workflow output directory: results/rastair/
call/sample.rastair_call.txt- Individual methylation calls file sorted by genomic coordinates and including cytosine context.
mbias/sample.rastair_mbias.txt- Average conversion rate per position on the read per read pair (R1 and R2) original strand (OT, OB).
mbiasparser/sample.rastair_mbias_processed.csv- File reporting the dynamic trimming to be passed to the rastair/call process.
methylkit/sample.rastair_methylkit.txt.gz- Individual methylation calls in a format digestible by MethylKit R package.
Targeted Sequencing
If --run_targeted_sequencing is set to true, the pipeline performs additional analysis for targeted sequencing experiments.
Filtered Methylation Calls
BedGraph files are filtered using the BED file passed to --target_regions_file.
Bismark output directory: results/bismark/methylation_calls/bedGraph/
bwa-meth output directory: results/methyldackel/
*.targeted.bedGraph- Methylation statuses in bedGraph format, limited to the positions in the target regions BED file.
Hybrid-selection (HS) Metrics
Picard CollectHsMetrics provides useful metrics to understand how well a targeted enrichment protocol performed, such as the library size or the fold-80 penalty. Here you can find a detailed list with all of them.
Output directory: results/enrichment_metrics
*.CollectHsMetrics.coverage_metrics- Text-based statistics showed also in the MultiQC report.
Bismark Reports
Bismark generates a HTML reports describing results for each sample, as well as a summary report for the whole run.
Output directory: results/bismark/reports/
Output directory: results/bismark/summary/
Qualimap
Qualimap BamQC is a general-use quality-control tool that generates a number of statistics about aligned BAM files. It’s not specific to bisulfite data, but it produces several useful stats - for example, insert size and coverage statistics.
Output directory: results/qualimap
sample/qualimapReport.html- Qualimap HTML report
sample/genome_results.txt,sample/raw_data_qualimapReport/*.txt- Text-based statistics that can be loaded into downstream programs
Preseq
Preseq estimates the complexity of a library, showing how many additional unique reads are sequenced for increasing the total read count. A shallow curve indicates that the library has reached complexity saturation and further sequencing would likely not add further unique reads. The dashed line shows a perfectly complex library where total reads = unique reads.
Note that these are predictive numbers only, not absolute. The MultiQC plot can sometimes give extreme sequencing depth on the X axis - click and drag from the left side of the plot to zoom in on more realistic numbers.
Output directory: results/preseq
sample_ccurve.txt- This file contains plot values for the complexity curve, plotted in the MultiQC report.
MultiQC
The FastQC plots displayed in the MultiQC report shows untrimmed reads. They may contain adapter sequence and potentially regions with low quality.
MultiQC
Output files
multiqc/multiqc_report.html: a standalone HTML file that can be viewed in your web browser.multiqc_data/: directory containing parsed statistics from the different tools used in the pipeline.multiqc_plots/: directory containing static images from the report in various formats.
MultiQC is a visualization tool that generates a single HTML report summarising all samples in your project. Most of the pipeline QC results are visualised in the report and further statistics are available in the report data directory.
Results generated by MultiQC collate pipeline QC from supported tools e.g. FastQC. The pipeline has special steps which also allow the software versions to be reported in the MultiQC output for future traceability. For more information about how to use MultiQC reports, see http://multiqc.info.
Pipeline information
Output files
pipeline_info/- Reports generated by Nextflow:
execution_report.html,execution_timeline.html,execution_trace.txtandpipeline_dag.dot/pipeline_dag.svg. - Reports generated by the pipeline:
pipeline_report.html,pipeline_report.txtandsoftware_versions.yml. Thepipeline_report*files will only be present if the--email/--email_on_failparameter’s are used when running the pipeline. - Reformatted samplesheet files used as input to the pipeline:
samplesheet.valid.csv. - Parameters used by the pipeline run:
params.json.
- Reports generated by Nextflow:
Nextflow provides excellent functionality for generating various reports relevant to the running and execution of the pipeline. This will allow you to troubleshoot errors with the running of the pipeline, and also provide you with other information such as launch commands, run times and resource usage.