nf-core/nascent
Nascent Transcription Processing Pipeline
Introduction
This document describes the output produced by the pipeline. Most of the plots are taken from the MultiQC report, which summarises results at the end of the pipeline.
The directories listed below will be created in the results directory after the pipeline has finished. All paths are relative to the top-level results directory.
Pipeline overview
The pipeline is built using Nextflow and processes data using the following steps:
- Preprocessing
- Alignment
- Alignment post-processing
- SAMtools - Sort and index alignments
- UMI-tools dedup - UMI-based deduplication
- picard MarkDuplicates - Duplicate read marking
- Quality control
- Coverage Graphs
- BEDTools Genomecov - Create bedGraph coverage files
- deepTools bamcoverage - Create bigWig coverage files
- Transcript Identification
- GroHMM - Predicts transcripts from aligned GROSeq data in the form of bed files.
- HOMER - Transcript identification from GROSeq data
- PINTS - Identifies transcriptional regulatory elements (TREs) identified from nascent-transcript sequencing.
- BEDTools Insersect - Filtering of predicted TREs
- Quantification
- featureCounts - Read counting relative to gene biotype
- MultiQC - Aggregate report describing results and QC from the whole pipeline
- Pipeline information - Report metrics generated during the workflow execution
Preprocessing
FastQC
Output files
preprocessing/fastqc*_fastqc.html: FastQC report containing quality metrics.*_fastqc.zip: Zip archive containing the FastQC report, tab-delimited data file and plot images.
FastQC gives general quality metrics about your sequenced reads. It provides information about the quality score distribution across your reads, per base sequence content (%A/T/G/C), adapter contamination and overrepresented sequences. For further reading and documentation see the FastQC help pages.


The FastQC plots displayed in the MultiQC report shows untrimmed reads. They may contain adapter sequence and potentially regions with low quality.
fastp
Output files
preprocessing/fastp*.fastp.html: Trimming report in html format.*.fastp.json: Trimming report in json format.*.fastp.log: Trimming log file.
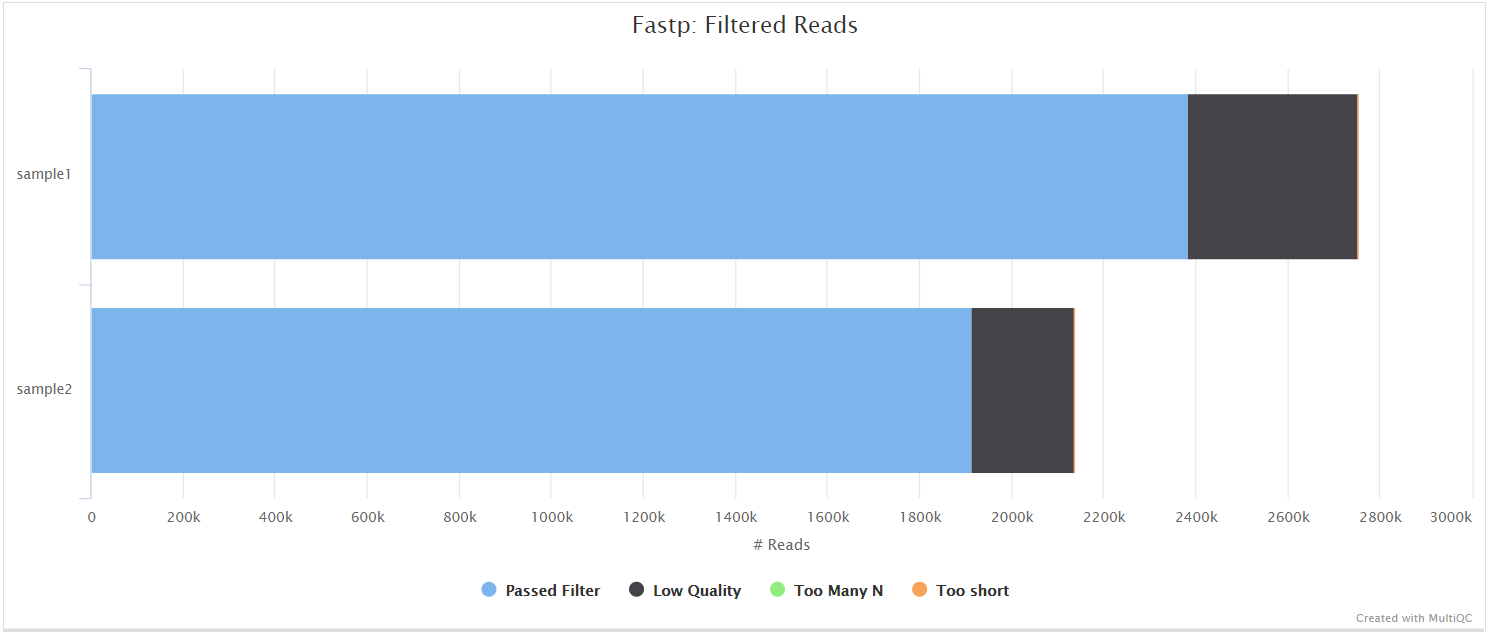
fastp is a tool designed to provide fast, all-in-one preprocessing for FastQ files. It has been developed in C++ with multithreading support to achieve higher performance. fastp is used in this pipeline for standard adapter trimming and quality filtering.
Alignment
bwa
Output files
bwa/*.bam: The original BAM file containing read alignments to the reference genome.
BWA is a software package for mapping low-divergent sequences against a large reference genome. The aligned reads are then coordinate-sorted is used for duplicate marking) with samtools.
bwa-mem2
Output files
bwamem2/*.bam: The original BAM file containing read alignments to the reference genome.
BWA-mem2 is a software package for mapping low-divergent sequences against a large reference genome.The aligned reads are then coordinate-sorted with samtools.
DRAGMAP
Output files
dragmap/*.bam: The original BAM file containing read alignments to the reference genome.*.dragmap.log: Log of the stderr from the aligner
DragMap is an open-source software implementation of the DRAGEN mapper, which the Illumina team created so that we would have an open-source way to produce the same results as their proprietary DRAGEN hardware. The aligned reads are then coordinate-sorted with samtools.
Bowtie 2
Output files
bowtie2/*.bam: The original BAM file containing read alignments to the reference genome.*.bowtie2.log: Log of the stderr from the aligner
Bowtie 2 is an ultrafast and memory-efficient tool for aligning sequencing reads to long reference sequences. It is particularly good at aligning reads of about 50 up to 100s or 1,000s of characters, and particularly good at aligning to relatively long (e.g. mammalian) genomes. Bowtie 2 indexes the genome with an FM Index to keep its memory footprint small: for the human genome, its memory footprint is typically around 3.2 GB. Bowtie 2 supports gapped, local, and paired-end alignment modes.
The aligned reads are then coordinate-sorted with samtools.
HISAT2
Output files
hisat2/<SAMPLE>.bam: The original BAM file containing read alignments to the reference genome.
hisat2/log/*.log: HISAT2 alignment report containing the mapping results summary.
hisat2/unmapped/*.fastq.gz: FastQ files containing unmapped reads will be placed in this directory.
HISAT2 is a fast and sensitive alignment program for mapping next-generation sequencing reads (both DNA and RNA) to a population of human genomes as well as to a single reference genome. It introduced a new indexing scheme called a Hierarchical Graph FM index (HGFM) which when combined with several alignment strategies, enable rapid and accurate alignment of sequencing reads. The HISAT2 route through the pipeline is a good option if you have memory limitations on your compute. However, quantification isn’t performed if using --aligner hisat2 due to the lack of an appropriate option to calculate accurate expression estimates from HISAT2 derived genomic alignments. However, you can use this route if you have a preference for the alignment, QC and other types of downstream analysis compatible with the output of HISAT2.
You can choose to align your data with HISAT2 by providing the --aligner hisat2 parameter.
Alignment post-processing
SAMtools
Output files
<ALIGNER>/<SAMPLE>.sorted.bam: If--save_align_intermedsis specified the original coordinate sorted BAM file containing read alignments will be placed in this directory.<SAMPLE>.sorted.bam.bai: If--save_align_intermedsis specified the BAI index file for the original coordinate sorted BAM file will be placed in this directory.<SAMPLE>.sorted.bam.csi: If--save_align_intermeds --bam_csi_indexis specified the CSI index file for the original coordinate sorted BAM file will be placed in this directory.
<ALIGNER>/samtools_stats/- SAMtools
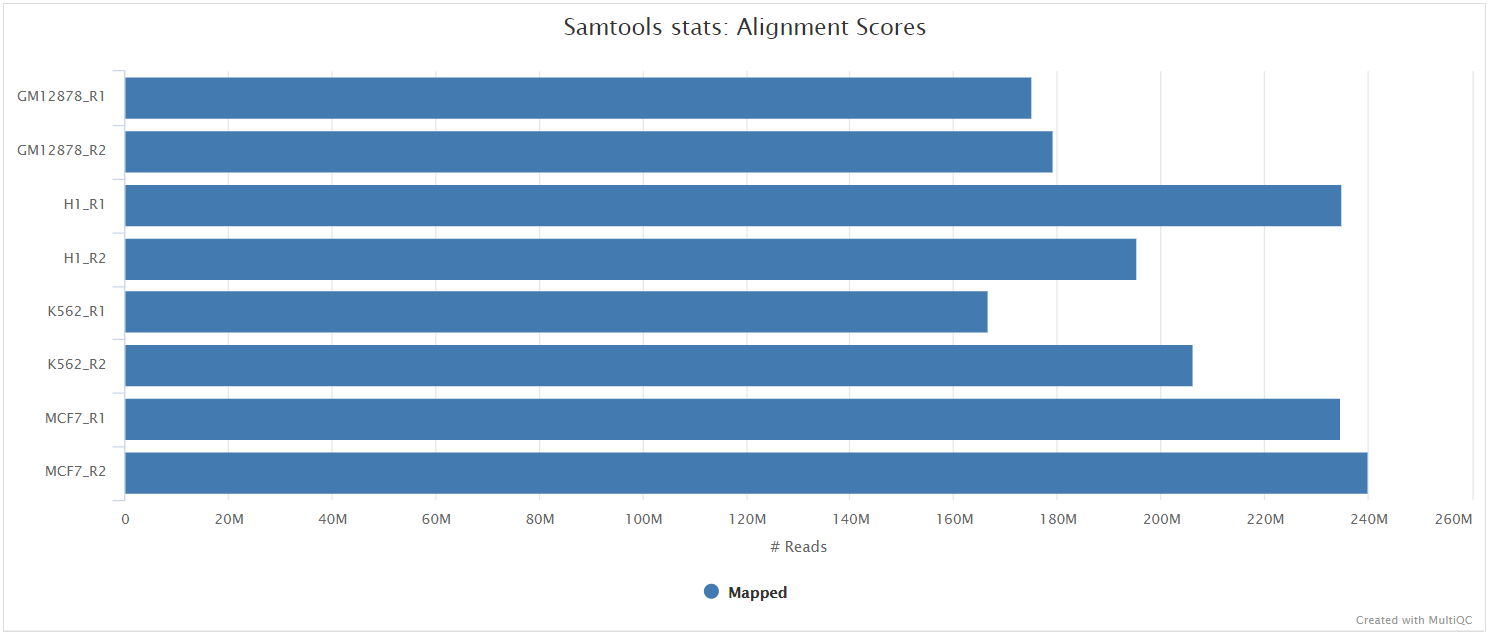
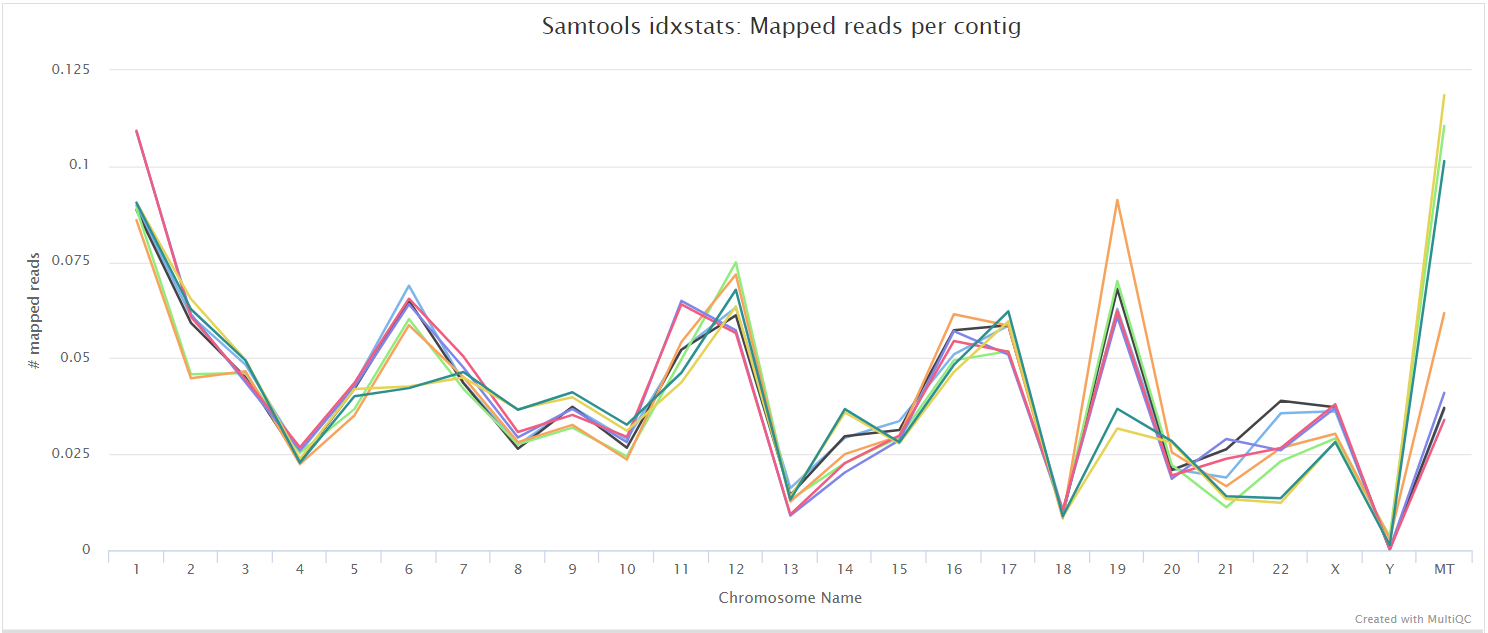
<SAMPLE>.sorted.bam.flagstat,<SAMPLE>.sorted.bam.idxstatsand<SAMPLE>.sorted.bam.statsfiles generated from the alignment files.
- SAMtools
The original BAM files generated by the selected alignment algorithm are further processed with SAMtools to sort them by coordinate, for indexing, as well as to generate read mapping statistics.
UMI-tools dedup
Output files
<ALIGNER>/<SAMPLE>.umi_dedup.sorted.bam: If--save_umi_intermedsis specified the UMI deduplicated, coordinate sorted BAM file containing read alignments will be placed in this directory.<SAMPLE>.umi_dedup.sorted.bam.bai: If--save_umi_intermedsis specified the BAI index file for the UMI deduplicated, coordinate sorted BAM file will be placed in this directory.<SAMPLE>.umi_dedup.sorted.bam.csi: If--save_umi_intermeds --bam_csi_indexis specified the CSI index file for the UMI deduplicated, coordinate sorted BAM file will be placed in this directory.
<ALIGNER>/umitools/*_edit_distance.tsv: Reports the (binned) average edit distance between the UMIs at each position.*_per_umi.tsv: UMI-level summary statistics.*_per_umi_per_position.tsv: Tabulates the counts for unique combinations of UMI and position.
The content of the files above is explained in more detail in the UMI-tools documentation.
After extracting the UMI information from the read sequence (see UMI-tools extract), the second step in the removal of UMI barcodes involves deduplicating the reads based on both mapping and UMI barcode information using the UMI-tools dedup command. This will generate a filtered BAM file after the removal of PCR duplicates.
picard MarkDuplicates
Output files
<ALIGNER>/<SAMPLE>.markdup.sorted.bam: Coordinate sorted BAM file after duplicate marking. This is the final post-processed BAM file and so will be saved by default in the results directory.<SAMPLE>.markdup.sorted.bam.bai: BAI index file for coordinate sorted BAM file after duplicate marking. This is the final post-processed BAM index file and so will be saved by default in the results directory.<SAMPLE>.markdup.sorted.bam.csi: CSI index file for coordinate sorted BAM file after duplicate marking. This is the final post-processed BAM index file and so will be saved by default in the results directory. Only generated if--bam_csi_indexis specified as a parameter.
<ALIGNER>/samtools_stats/- SAMtools
<SAMPLE>.markdup.sorted.bam.flagstat,<SAMPLE>.markdup.sorted.bam.idxstatsand<SAMPLE>.markdup.sorted.bam.statsfiles generated from the duplicate marked alignment files.
- SAMtools
<ALIGNER>/picard_metrics/<SAMPLE>.markdup.sorted.MarkDuplicates.metrics.txt: Metrics file from MarkDuplicates.
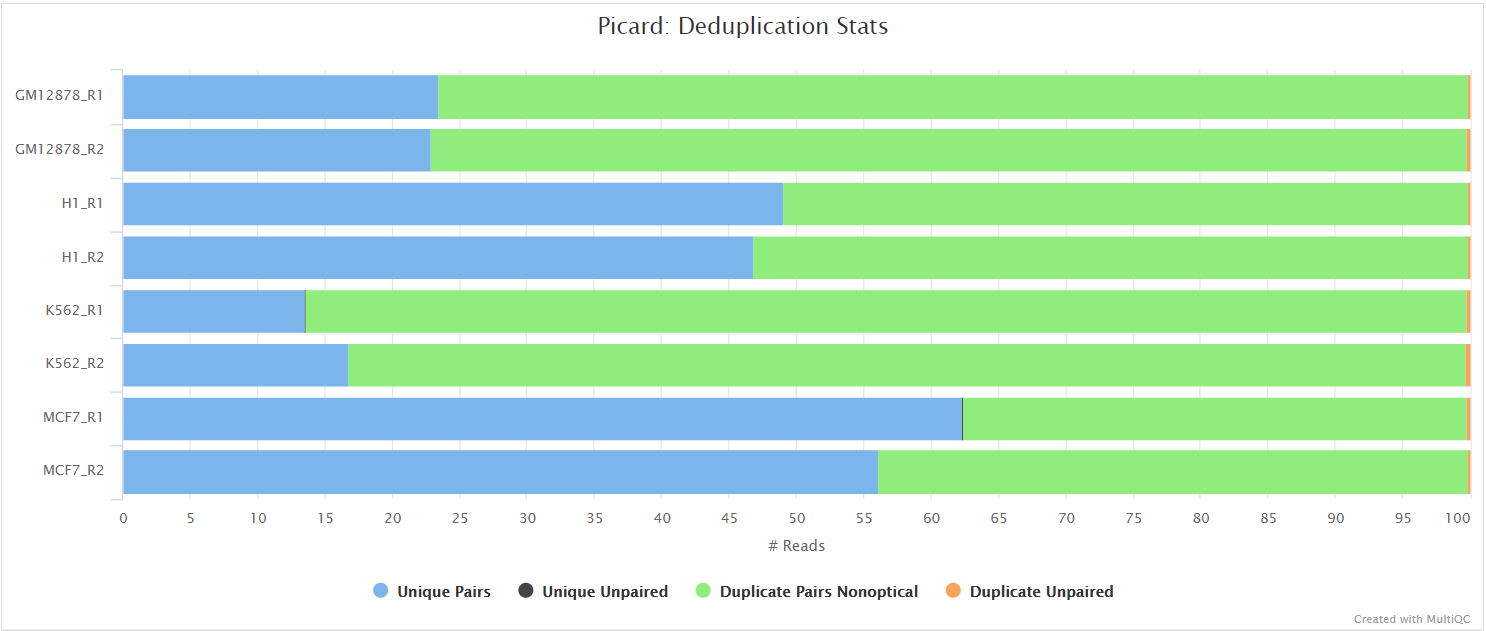
Unless you are using UMIs it is not possible to establish whether the fragments you have sequenced from your sample were derived via true biological duplication (i.e. sequencing independent template fragments) or as a result of PCR biases introduced during the library preparation. By default, the pipeline uses picard MarkDuplicates to mark the duplicate reads identified amongst the alignments to allow you to guage the overall level of duplication in your samples. However, for RNA-seq data it is not recommended to physically remove duplicate reads from the alignments (unless you are using UMIs) because you expect a significant level of true biological duplication that arises from the same fragments being sequenced from for example highly expressed genes. You can skip this step via the --skip_markduplicates parameter.
Quality control
RSeQC
RSeQC is a package of scripts designed to evaluate the quality of RNA-seq data. This pipeline runs several, but not all RSeQC scripts. You can tweak the supported scripts you would like to run by adjusting the --rseqc_modules parameter which by default will run all of the following: bam_stat.py, inner_distance.py, infer_experiment.py, junction_annotation.py, junction_saturation.py,read_distribution.py and read_duplication.py.
The majority of RSeQC scripts generate output files which can be plotted and summarised in the MultiQC report.
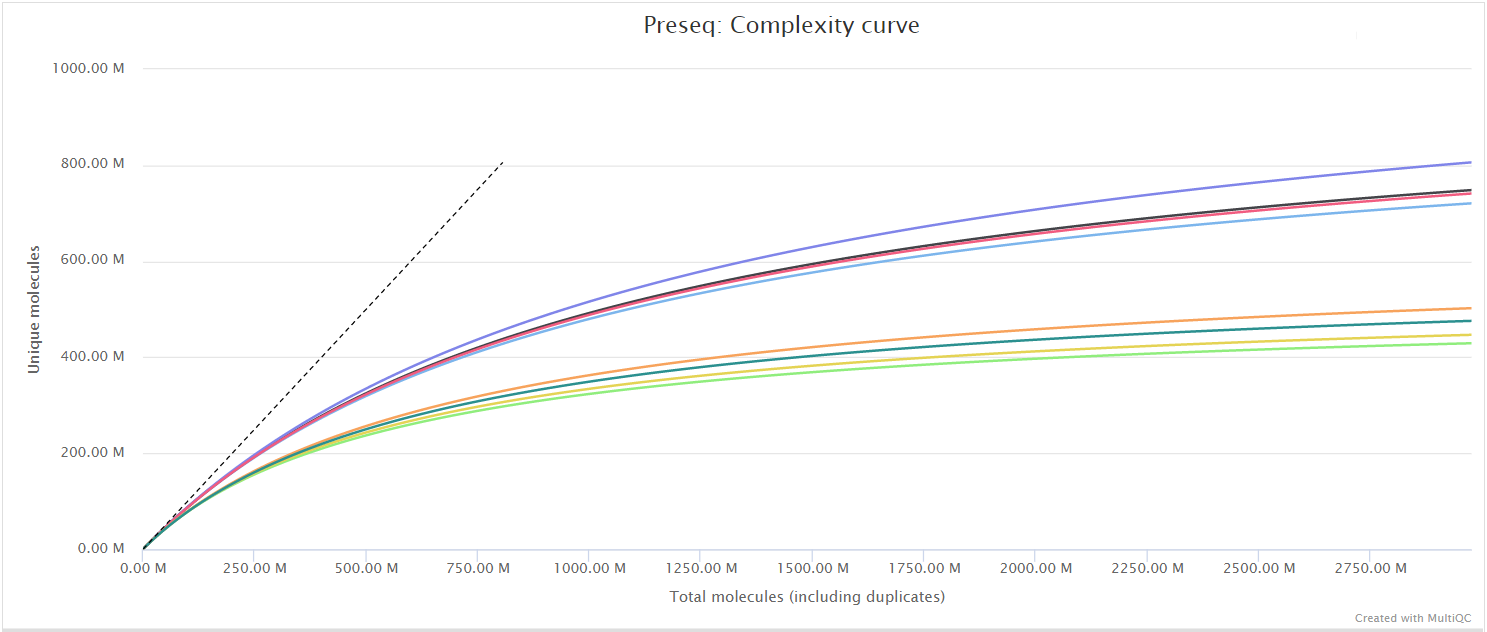
Preseq
Output files
quality_control/preseq/*.lc_extrap.txt: Preseq expected future yield file.*.c_curve.txt: Preseq cumulative coverage curve file.
quality_control/preseq/log/*.command.log: Standard error output from command.
The Preseq package is aimed at predicting and estimating the complexity of a genomic sequencing library, equivalent to predicting and estimating the number of redundant reads from a given sequencing depth and how many will be expected from additional sequencing using an initial sequencing experiment. The estimates can then be used to examine the utility of further sequencing, optimize the sequencing depth, or to screen multiple libraries to avoid low complexity samples. A shallow curve indicates that the library has reached complexity saturation and further sequencing would likely not add further unique reads. The dashed line shows a perfectly complex library where total reads = unique reads. Note that these are predictive numbers only, not absolute. The MultiQC plot can sometimes give extreme sequencing depth on the X axis - click and drag from the left side of the plot to zoom in on more realistic numbers.
BBMap
Output files
quality_control/bbmap/*.coverage.hist.txt: Histogram of read coverage over each chromosome*.coverage.stats.txt: Coverage stats broken down by chromosome including %GC, pos/neg read coverage, total coverage, etc.
BBMap includes a tool called pileup, which analyzes the sequencing coverage for each sample.
Coverage Graphs
BEDTools Genomecov
Output files
coverage_graphs/*.minus.bedGraph: Sample coverage file (negative strand only) in bedGraph format*.plus.bedGraph: Sample coverage file (positive strand only) in bedGraph format*.dreg.bedGraph: Sample coverage file (dreg) in bedGraph format prepared using proseq2.0 pipeline
deepTools bamcoverage
Output files
coverage_graphs/*.minus.bigWig: Sample coverage file (negative strand only) in bigWig format*.plus.bigWig: Sample coverage file (positive strand only) in bigWig format
Transcript Identification
HOMER
Output files
transcript_identification/homer/*.bed: HOMER Nascent RNA (GroSeq) transcripts after pos2bed*.peaks.txt: HOMER Nascent RNA (GroSeq) transcripts*.bedGraph.gz: UCSC bedGraph*_tagdir: homer tagdir
HOMER HOMER (Hypergeometric Optimization of Motif EnRichment) is a suite of tools for Motif Discovery and next-gen sequencing analysis. It is a collection of command line programs for UNIX-style operating systems written in Perl and C++. HOMER was primarily written as a de novo motif discovery algorithm and is well suited for finding 8-20 bp motifs in large scale genomics data. HOMER contains many useful tools for analyzing ChIP-Seq, GRO-Seq, RNA-Seq, DNase-Seq, Hi-C and numerous other types of functional genomics sequencing data sets.
For now the pipeline only supports the HOMER groseq workflow, feel free to open an issue or PR if you’d like to see others. For more information about how to use HOMER, see the GRO-Seq Analysis Tutorial.
Per the HOMER GRO-Seq Analysis Tutorial:
In the case of technical replicates (i.e. runs from the same sequencing library), it is advisable to always “pool” the data. If they are biological replicates, it is often a good idea to keep them separate for and take advantage of their variability to refine your analysis. For some types of analysis, such as transcript identification, it is a good idea to create a single META-experiment that contains all of the GRO-Seq reads for a given cell type. This will provide increased power for identifying transcripts de novo.
The pipeline will pool the reads if they are in the same group. See #153 for the status of supporting other methods.
PINTS
Output files
transcript_identification/pints/*_bidirectional_peaks.bed: Bidirectional TREs (divergent + convergent) optional*_divergent_peaks.bed: Divergent TREs optional*_unidirectional_peaks.bed: Unidirectional TREs, maybe lncRNAs transcribed from enhancers (e-lncRNAs)
PINTS (Peak Identifier for Nascent Transcript Starts) is a tool used to identify narrower regions for potential regulatory elements (mainly promoters and enhancers, often referred to as a peak caller). PINTS was inspired by MACS2 with modifications specifically implemented for identifying eRNA TSSs from genome-wide TSS-assays.
For more information about how PINTS works, see the paper A comparison of experimental assays and analytical methods for genome-wide identification of active enhancers.
GroHMM
Output files
transcript_identification/grohmm/*.eval.txt: Evaluation of HMM Annotations*.final.transcripts.bed: Predicted transcripts*.tdFinal.txt: Final quality metrics*.tdplot_mqc.png: TD plot included in MultiQC*.transcripts.txt: Predicted transcripts in txt form*.tuning.csv: The tuning csv that was used
GroHMM is a computational tool for identifying unannotated and cell type-specific transcription units from GRO-seq data. The pipeline will predict, and then repair transcripts based on known errors to generate a final set of transcripts (in the form of a bed file) for further analysis. By default, tuning will be performed by inputting a preset comma-separated values file with two columns, each identifying tuning parameters - LtProbB and UTS. These refer to the log-transformed transition probability of switching from transcribed state to non-transcribed state and variance of the emission probability for reads in the non-transcribed state, respectively. The output of the tuning file, also a comma-separated values file, will list out the sum of errors and error rate per called transcript, which will enable Nextflow to specify optimal UTS and LtProbB values for the subsequent transcript identification step. The user may also choose to provide their own list of hold-out parameters to test (in the format of a .csv file), or skip the tuning process altogether due to time constraints. If the tuning process is skipped (‘—skip_tuning’) then the user may indicate the specific holdout parameters to use (‘—uts’ and ‘—ltprobb’) or choose to use the default parameters. The transcript calling step will use the two-state hidden Markov model (HMM) which GroHMM employs in order to identify boundaries of transcription across the genome in a de-novo manner. The output is a .bed file of transcripts used in downstream analysis.
For more information about how to use GROHMM, see the tutorial or documentation.
BEDTools intersect
Output files
bedtools/*_filtered.bed:
The pipeline optionally takes a filter_bed, which can then be used to filter the predicted transcripts before counting is performed. This could be promoter regions to drop or histone modifications, such as H3K4me1 and H3K27ac, which are often associated with enhancers.
From the PINTS documentation:
We assume distal bidirectional transcripts are mainly from enhancer RNA transcription. To extract candidate enhancers from the pool of all TREs, we need a bed file that defines proximal TREs (promoters), then we can use bedtools to extract distal TREs as follows:
bedtools intersect -a SampleA_1_bidirectional_peaks.bed -b promoters.bed -v > SampleA_1_bidirectional_peaks.distalTREs.bed
They’ve also created some bed files that might be useful for analysis.
We have prepared promoter reference bed files (500 bp regions flanking protein-coding transcripts) for human and mouse genomes:
- promoter for hg38: based on GENCODE annotation (v24)
- promoter for hg19: based on GENCODE annotation (v19)
- promoter for mm10: based on GENCODE annotation (m23)
Quantification
featureCounts
Output files
quantification/featurecounts/gene/*.featureCounts.txt: featureCounts biotype-level quantification results for each sample.gene/*.featureCounts.txt.summary: featureCounts summary file containing overall statistics about the counts.nascent/*.featureCounts.txt: featureCounts of nascent transcripts quantification results for each sample.nascent/*.featureCounts.txt.summary: featureCounts summary file of the nascent transcripts containing overall statistics about the counts.
featureCounts from the Subread package is a quantification tool used to summarise the mapped read distribution over genomic features such as genes, exons, promotors, gene bodies, genomic bins and chromosomal locations. We can also use featureCounts to count overlaps with different classes of genomic features. This provides an additional QC to check which features are most abundant in the sample, and to highlight potential problems such as rRNA contamination.
Workflow reporting and genomes
Reference genome files
Output files
reference/*.fa,*.gtf,*.gff,*.bed,.tsv: If the--save_referenceparameter is provided then all of the genome reference files will be placed in this directory.bwa/: Directory containing bwa indices.bwa-mem2/: Directory containing bwa-mem2 indices.dragmap/: Directory containing DRAGMAP indices.bowtie2/: Directory containing bowtie2 indices.
A number of genome-specific files are generated by the pipeline because they are required for the downstream processing of the results. If the --save_reference parameter is provided then these will be saved in the genome/ directory. It is recommended to use the --save_reference parameter if you are using the pipeline to build new indices so that you can save them somewhere locally. The index building step can be quite a time-consuming process and it permits their reuse for future runs of the pipeline to save disk space.
MultiQC
Output files
multiqc/multiqc_report.html: a standalone HTML file that can be viewed in your web browser.multiqc_data/: directory containing parsed statistics from the different tools used in the pipeline.multiqc_plots/: directory containing static images from the report in various formats.
MultiQC is a visualization tool that generates a single HTML report summarising all samples in your project. Most of the pipeline QC results are visualised in the report and further statistics are available in the report data directory.
Results generated by MultiQC collate pipeline QC from supported tools e.g. FastQC. The pipeline has special steps which also allow the software versions to be reported in the MultiQC output for future traceability. For more information about how to use MultiQC reports, see http://multiqc.info.
Pipeline information
Output files
pipeline_info/- Reports generated by Nextflow:
execution_report.html,execution_timeline.html,execution_trace.txtandpipeline_dag.dot/pipeline_dag.svg. - Reports generated by the pipeline:
pipeline_report.html,pipeline_report.txtandsoftware_versions.yml. Thepipeline_report*files will only be present if the--email/--email_on_failparameter’s are used when running the pipeline. - Reformatted samplesheet files used as input to the pipeline:
samplesheet.valid.csv. - Parameters used by the pipeline run:
params.json.
- Reports generated by Nextflow:
Nextflow provides excellent functionality for generating various reports relevant to the running and execution of the pipeline. This will allow you to troubleshoot errors with the running of the pipeline, and also provide you with other information such as launch commands, run times and resource usage.