nf-core/neutronstar
De novo assembly pipeline for 10X linked-reads using Supernova
22.10.6.
Learn more.
Output
This document describes the output produced by the pipeline. Most of the plots are taken from the MultiQC report, which summarises results at the end of the pipeline.
Pipeline overview
The pipeline is built using Nextflow and processes data using the following steps:
Supernova
By default the output from Supernova will be stored in two places.
-
./results/supernova/sample_id- This contains the assembly graph files, log files and statistics from supernova_asm1. See the documentation from 10XG for more details. -
./results/assemblies/sample_id[.phased].fasta- These are the assembly fasta files. Two of the four outputs from Supernova are generated:- sample_id.fasta, the
pseudohaploidversion - sample_id.phased.fasta, the
megabubblesversion where haplotypes are included as two separate fasta entries.
- sample_id.fasta, the
To generate the two other output types, for instance raw you can use the command:
supernova mkoutput --asmdir=./results/supernova/sample_id/outs/assembly --style=raw --outprefix=sample_id.rawThe MultiQC report will add the statistics from Supernova to a table
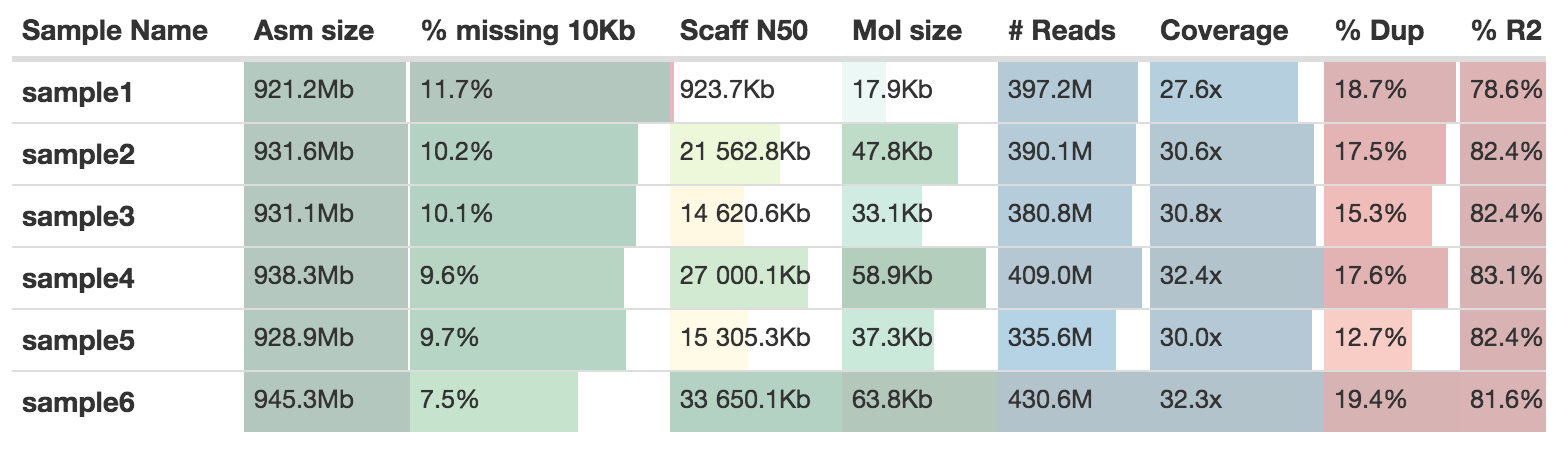
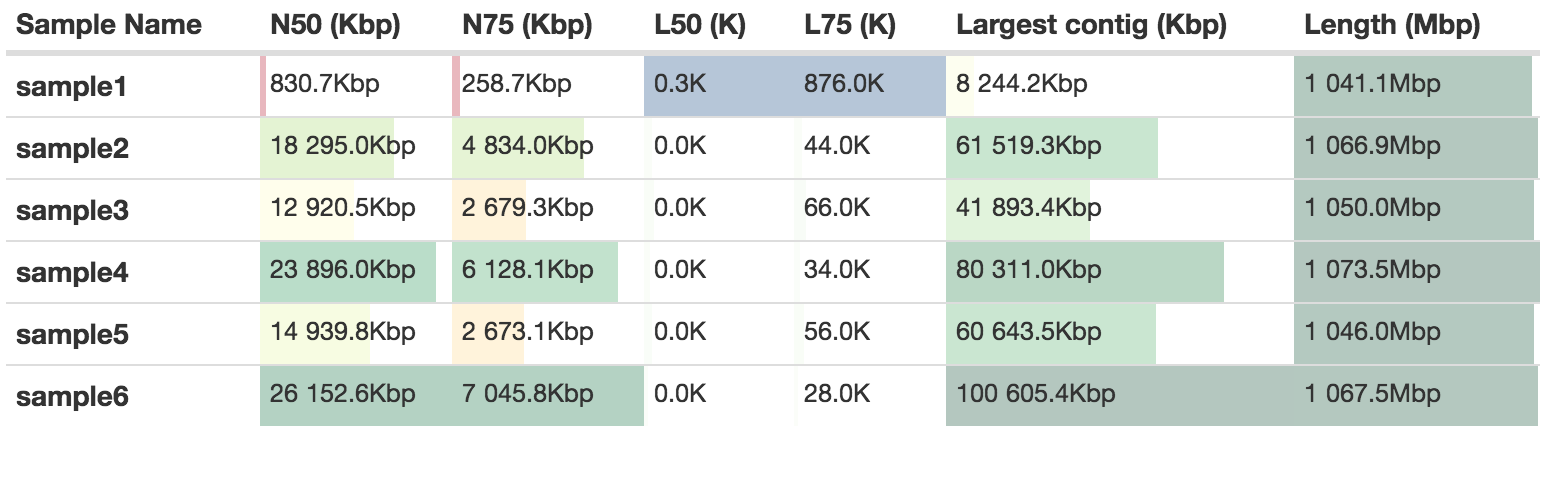
QUAST
Quast will give a measurement of assembly contiguity independent of Supernova. There will be a slight difference because of the way that Supernova calculates this. Compare for instance the scaffold N50 values with the ones from the previous table:
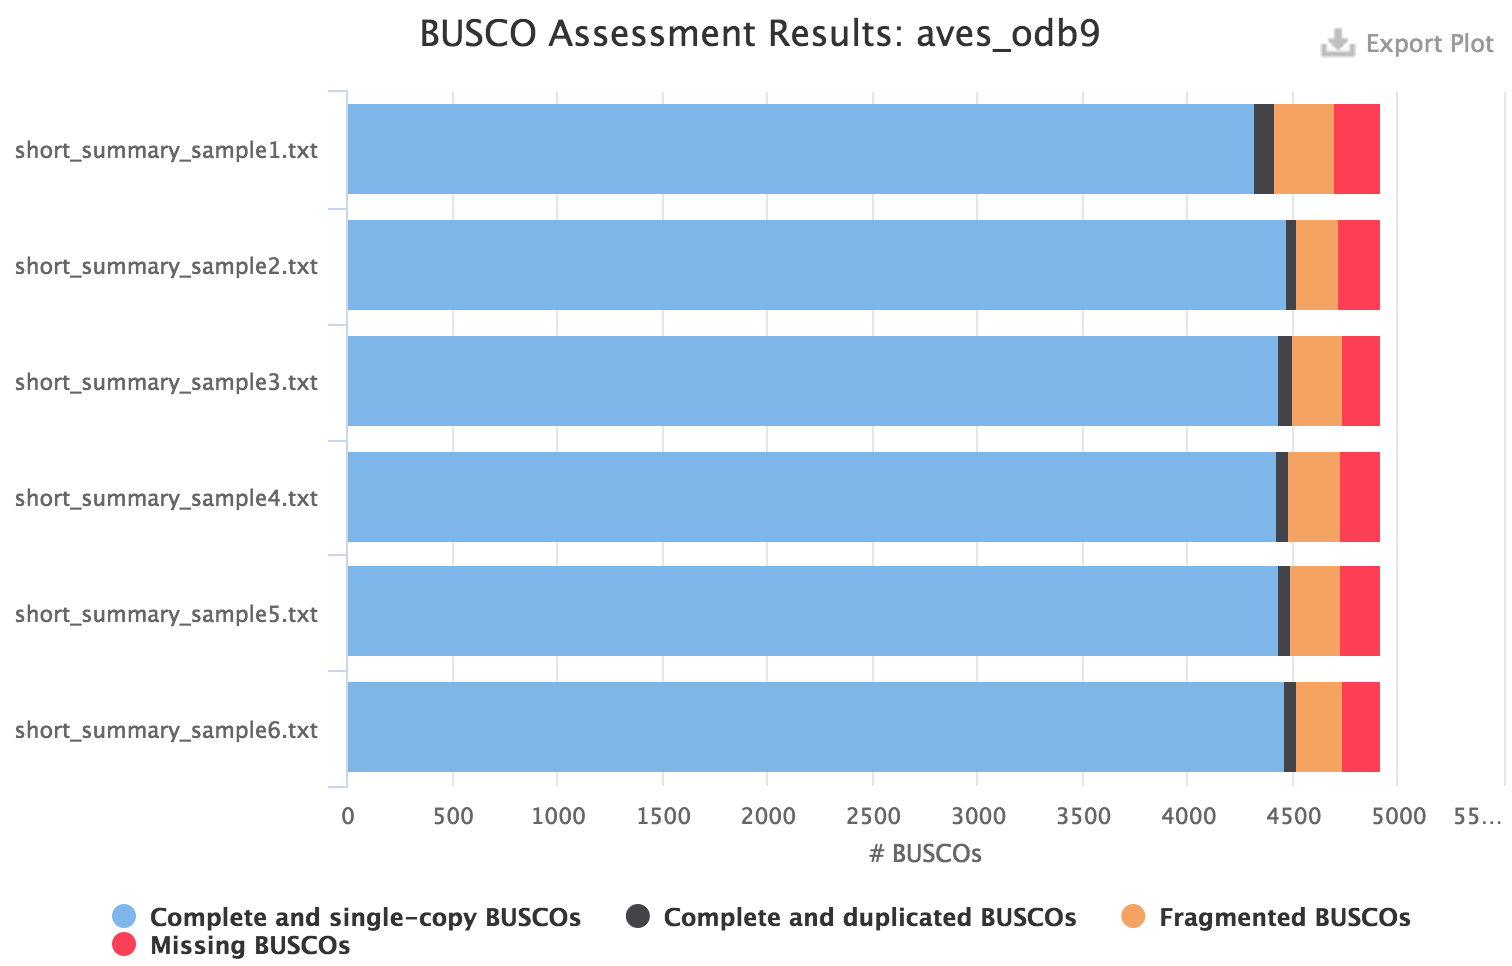
BUSCO
Please see the user manual for BUSCO to understand the meaning of the category of orthologs found in the assembly. For instance for a eukaryote species, you might want to use the eukaryota_odb9 dataset to quickly get a result. However it is recommended to use the most specific dataset available, for instance for birds the aves_odb9 dataset:
MultiQC
MultiQC is a visualisation tool that generates a single HTML report summarising all samples in your project. Most of the pipeline QC results are visualised in the report and further statistics are available in within the report data directory.
The pipeline has special steps which allow the software versions used to be reported in the MultiQC output for future traceability.
Output directory: results/multiqc
Project_multiqc_report.html- MultiQC report - a standalone HTML file that can be viewed in your web browser
Project_multiqc_data/- Directory containing parsed statistics from the different tools used in the pipeline
For more information about how to use MultiQC reports, see http://multiqc.info