nf-core/slamseq
SLAMSeq processing and analysis pipeline
22.10.6.
Learn more.
Output
This document describes the output produced by the pipeline. Most of the plots are taken from the MultiQC report, which summarises results at the end of the pipeline.
Pipeline overview
The pipeline is built using Nextflow and processes data using the following steps:
- Adapter trimming (
Trim Galore!) - Conversion-aware mapping (
Slamdunk) - Alignment filtering and multimapper recovery (
Slamdunk) - SNP calling to filter T>C SNPs (
Slamdunk) - Total and converted read quantification (
Slamdunk) - Collapsing quantifications on gene level (
Slamdunk) - Calculating QC stats (
Slamdunk)- Summary-statistics for nucleotide-conversions on a read level
- Summary-statistics for nucleotide-conversions on a gene level
- Summary-statistics for nucleotide-conversions along read positions
- Summary-statistics for nucleotide-conversions along gene positions
- Summarising Slamdunk results (
Slamdunk)- Sequenced reads
- Mapped reads
- Retained reads
- Counted reads
- Determine direct transcriptional targets (
DESeq2) - Present QC for raw read, trimming, alignment, filtering and quantification (
MultiQC,R)
TrimGalore
The nfcore/slamseq pipeline uses TrimGalore for removal of adapter contamination and trimming of low quality regions. TrimGalore uses Cutadapt for adapter trimming and runs FastQC after it finishes.
MultiQC reports the percentage of bases removed by TrimGalore in the General Statistics table, along with a line plot showing where reads were trimmed.
Slamdunk
Slamdunk is a software to map and quantify nucleotide-conversion containing read sets with ultra-high sensitivity. The nfcore/slamseq pipeline uses Slamdunk for mapping SLAMseq datasets, calculating QC metrics and extracting both total and converted read counts for differential transcriptional output analysis.
It produces several QC plots summarised in a MultiQC report, the most important ones being briefly described here:
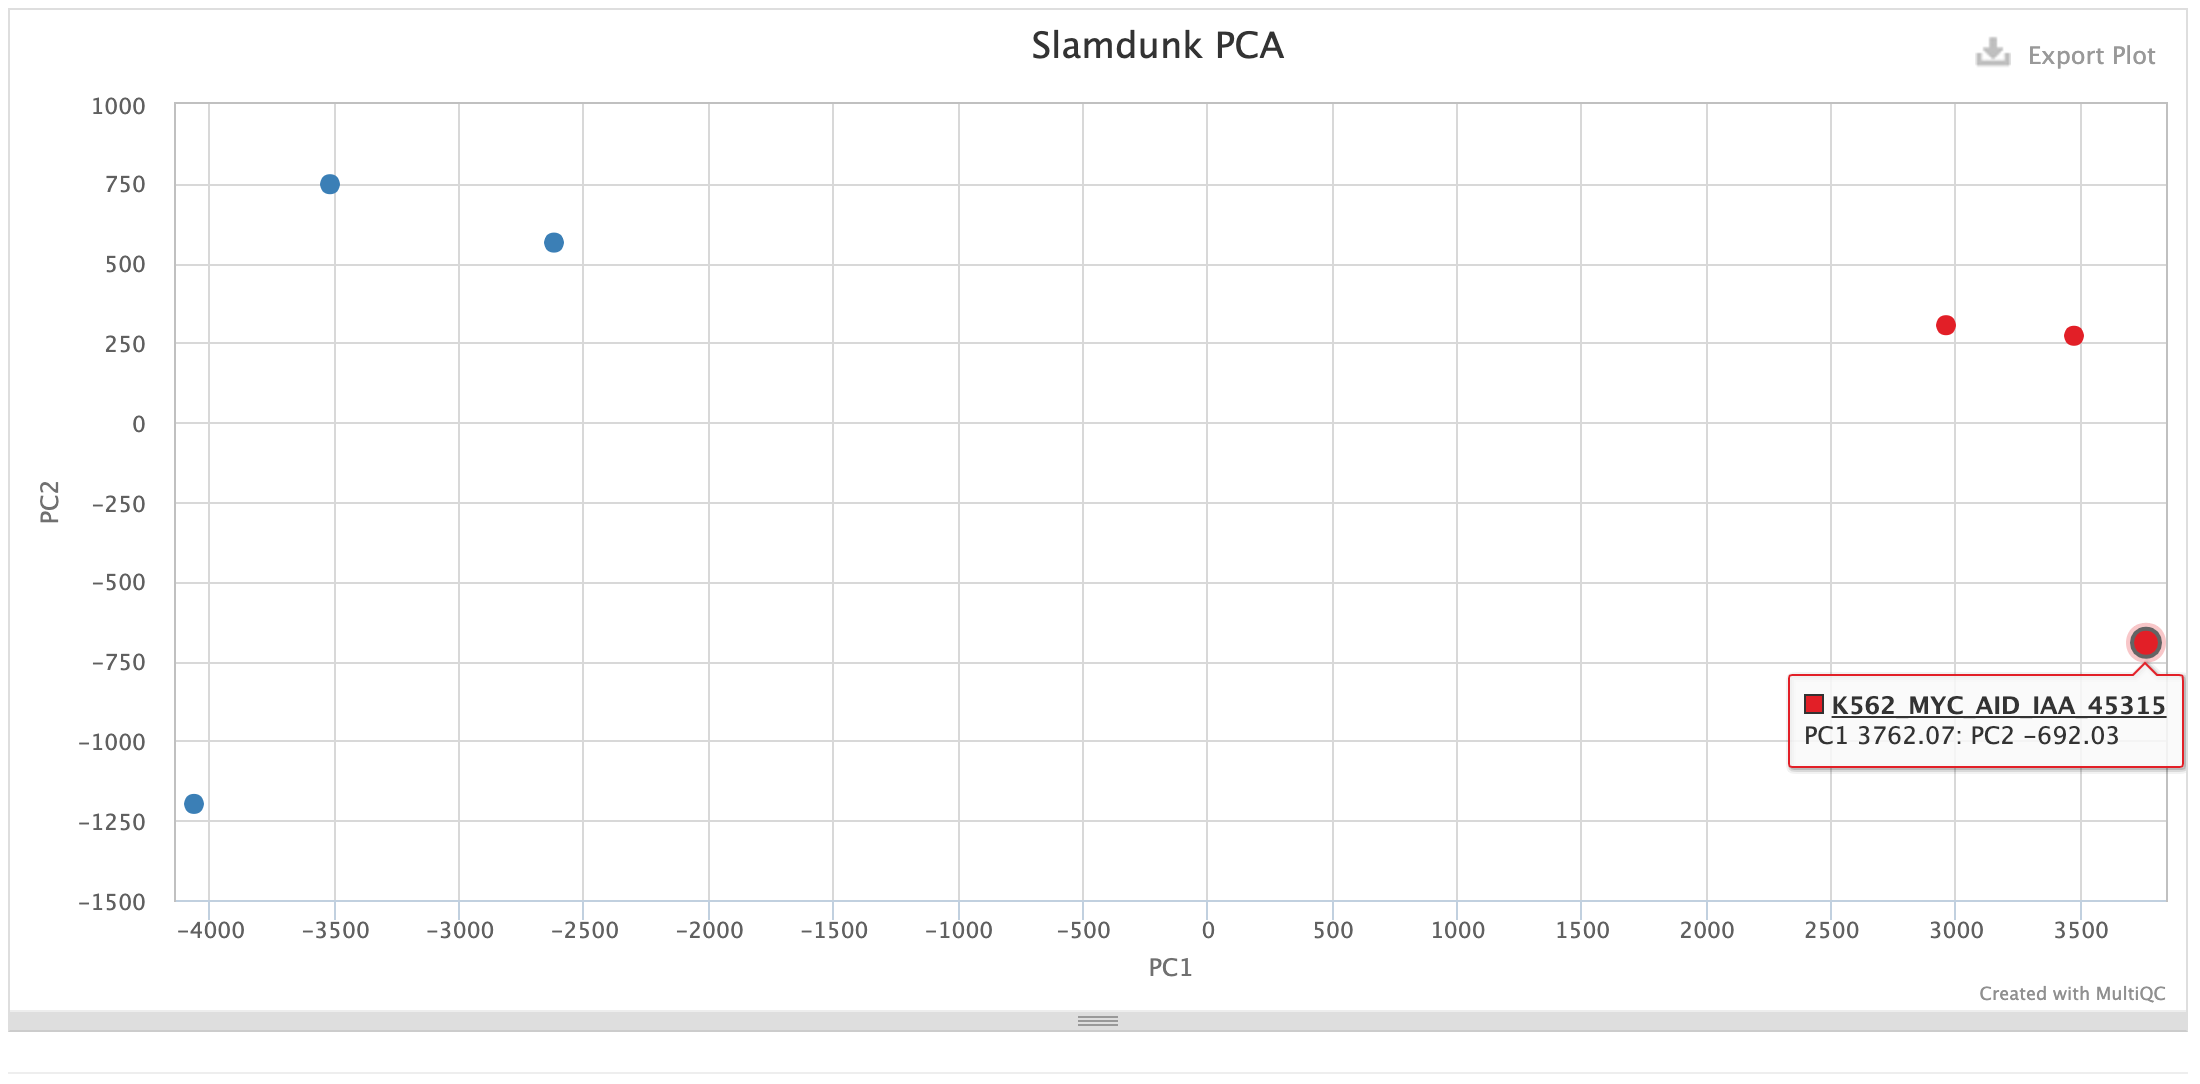
PCA:
This PCA plot is calculated on the T>C converted reads from newly synthesized transcripts. They should best capture immediate changes within our samples, even when there can be no steady-state changes detected.
As with every PCA plot, your replicates should cluster together and your conditions apart.
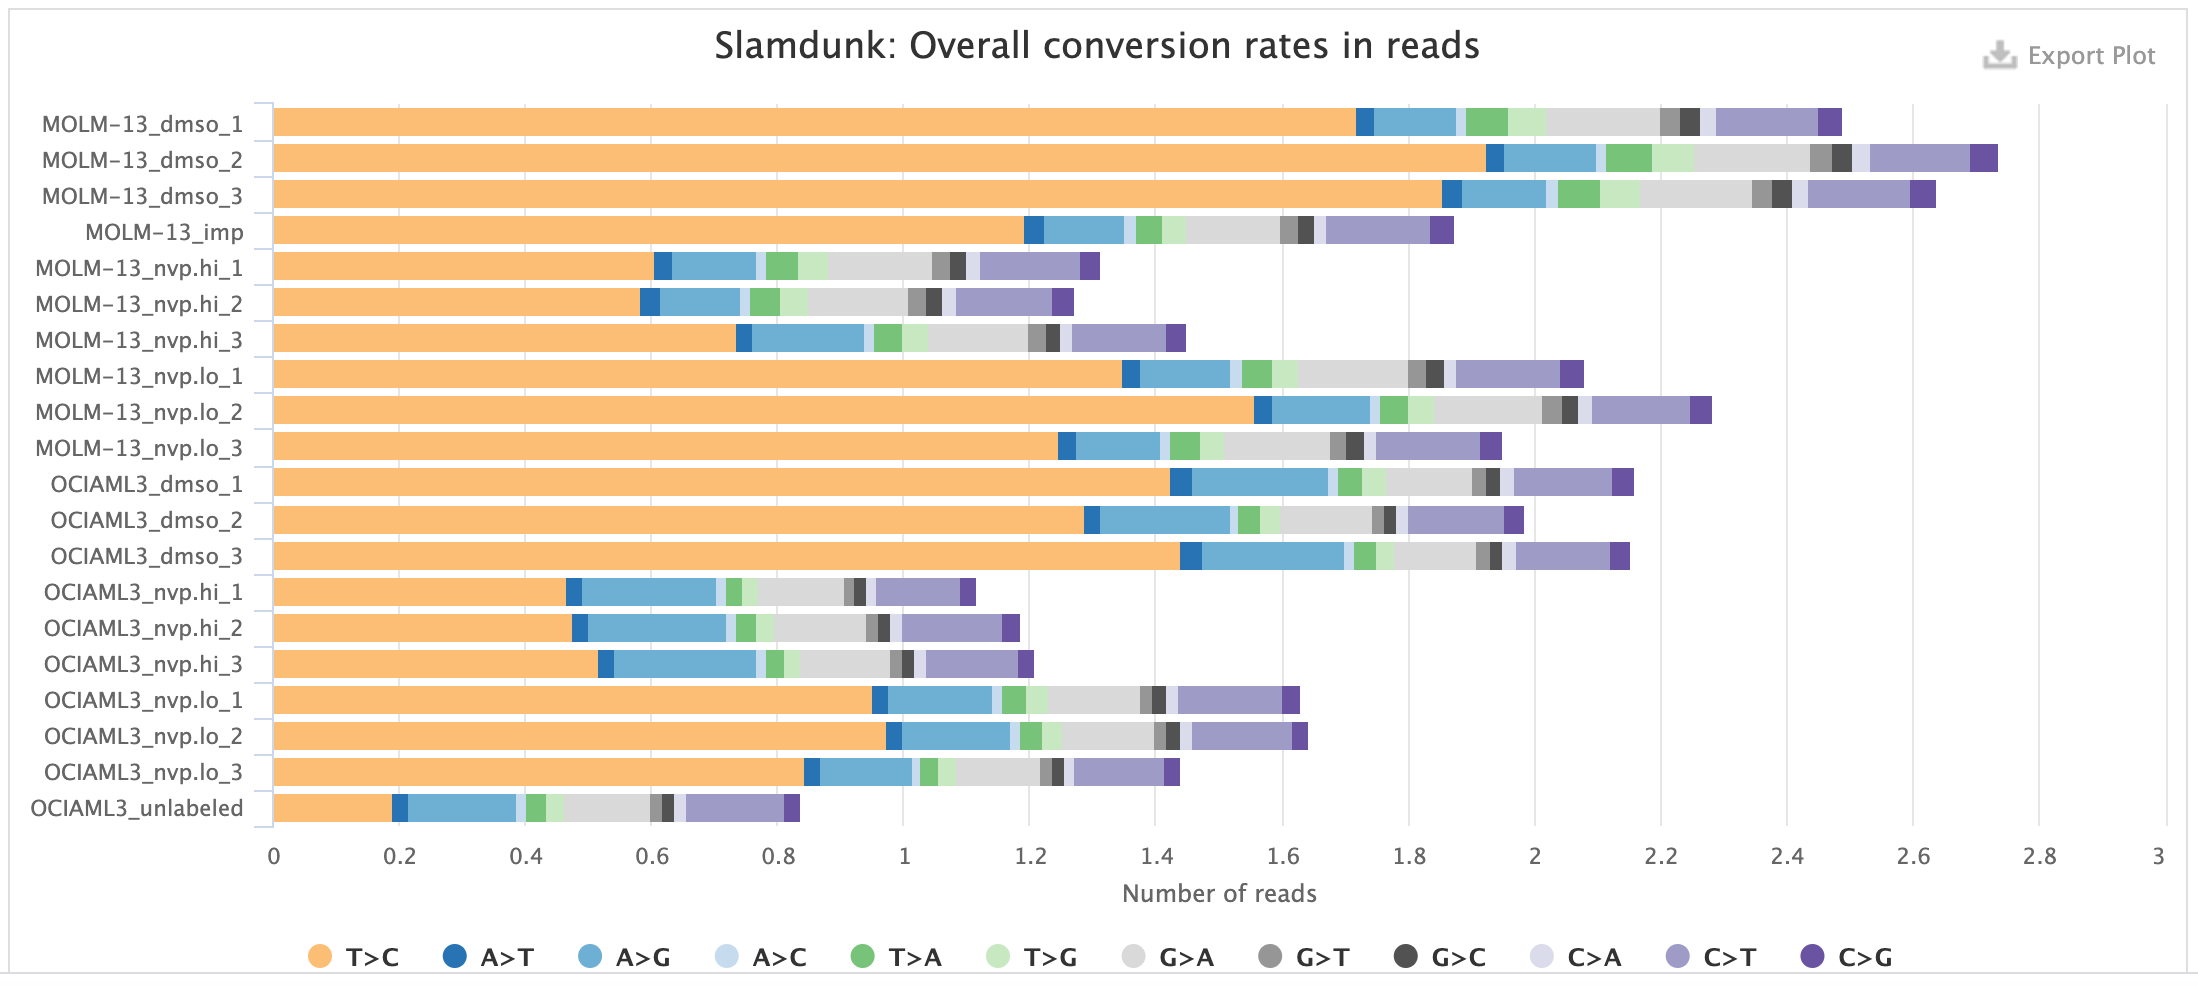
Rates:
This plot shows the individual base substitutions in your reads across the entire read set. For SLAMseq datasets you should see an excess of T>C conversions with increasing labelling times. The plot below shows samples with mock treatment (DMSO) and transcriptional inhibition with a CDK9-inhibitor (NVP) where transcription is blocked which is reflected in the loss of the T>C conversion excess.
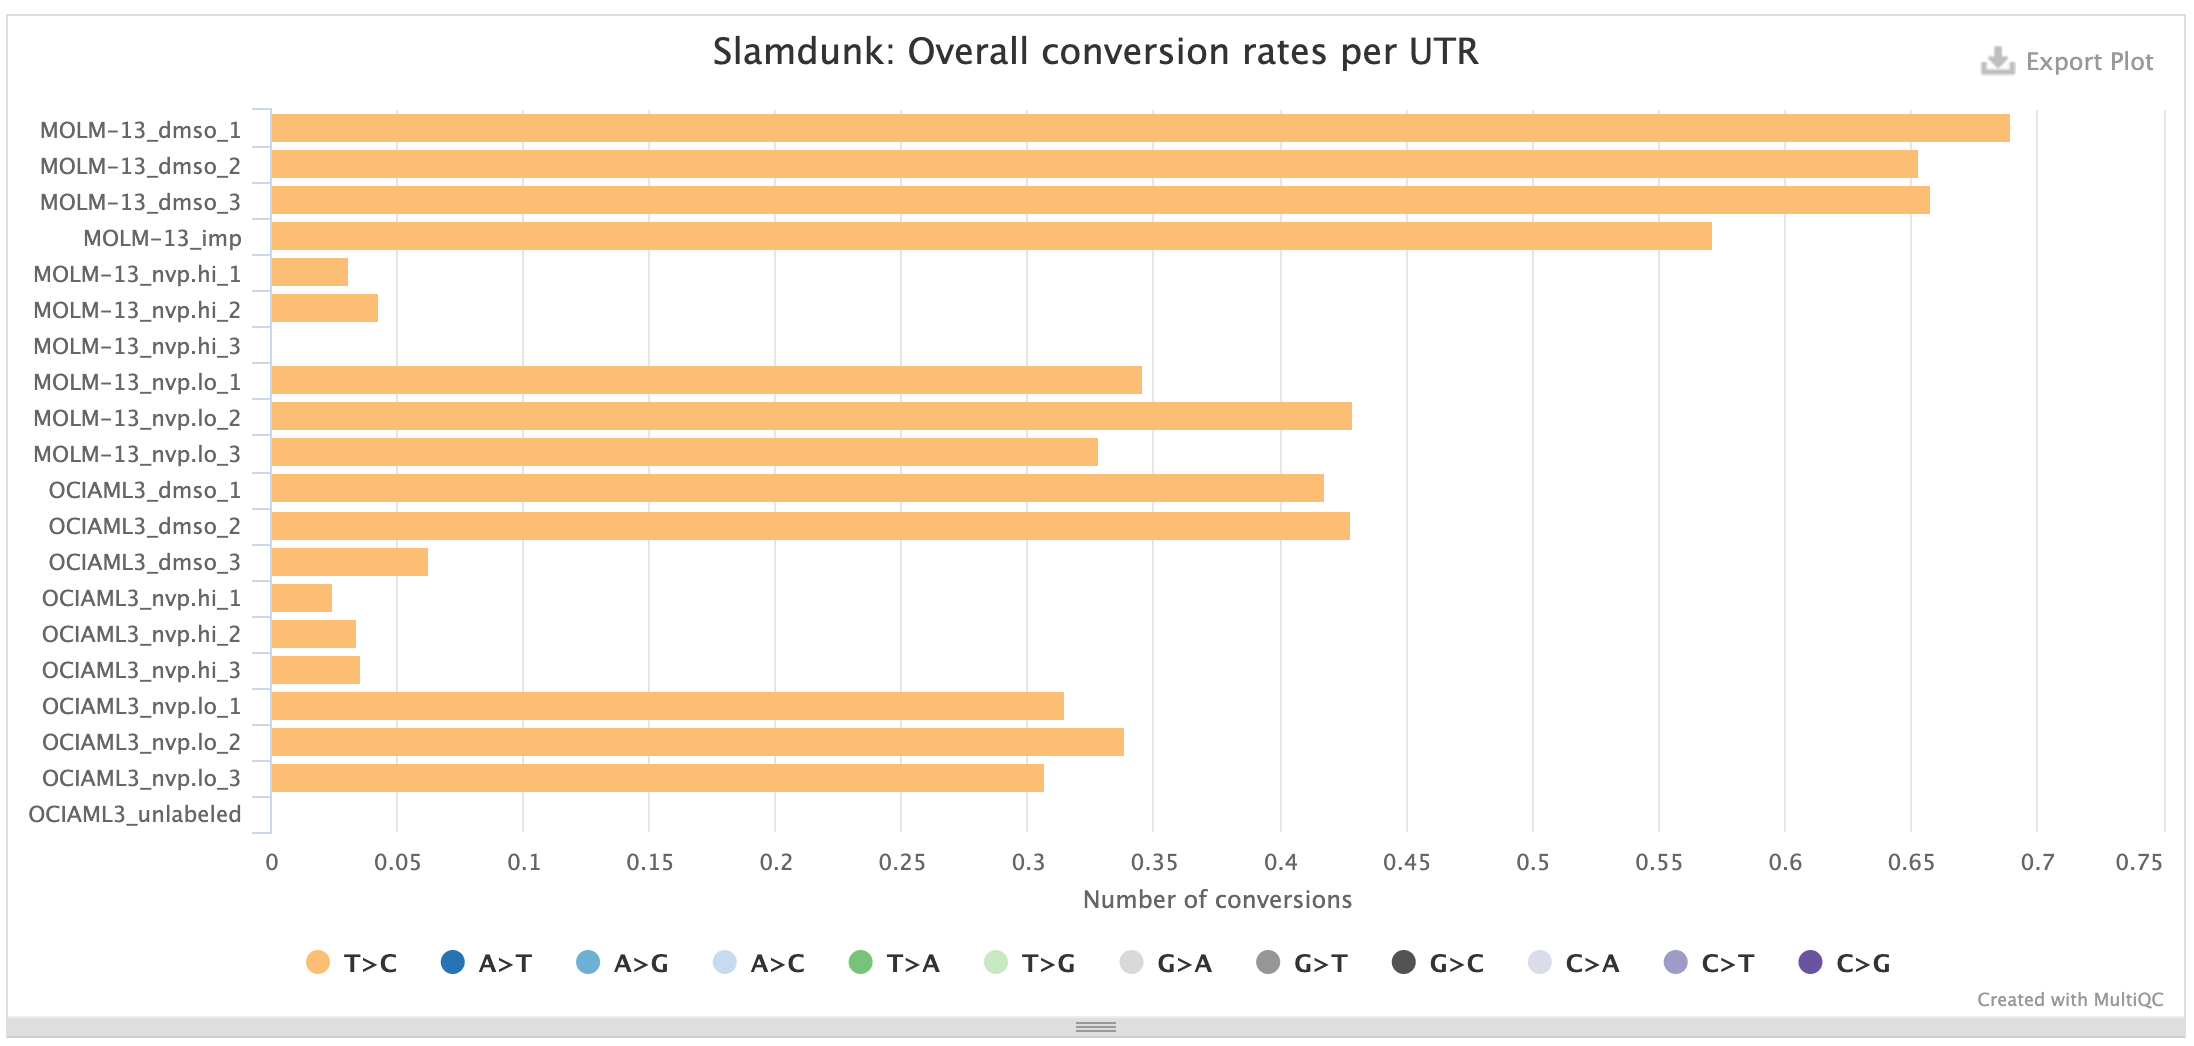
UTR rates:
This plot shows the median base substitutions in the annotated UTRs across the entire read set. For SLAMseq datasets you should only observe median T>C conversions > 0, the remaining substitutions should remain in background. The plot below shows the UTR rates for the same samples as above: samples with mock treatment (DMSO) and transcriptional inhibition with a CDK9-inhibitor (NVP) where transcription is blocked which is reflected in the loss of the T>C conversion excess.
Conversions per read position:
This plot shows the individual base substitutions across read positions across the entire read set. For SLAMseq datasets the background conversion levels should be consistent across all base conversions and read positions, for T>C conversions they should be stratified by labelling time. The plots below first show the background conversions and then as contrast the T>C conversions for th same samples as above: samples with mock treatment (DMSO) and transcriptional inhibition with a CDK9-inhibitor (NVP) where transcription is blocked which is reflected in the loss of the T>C conversion excess.
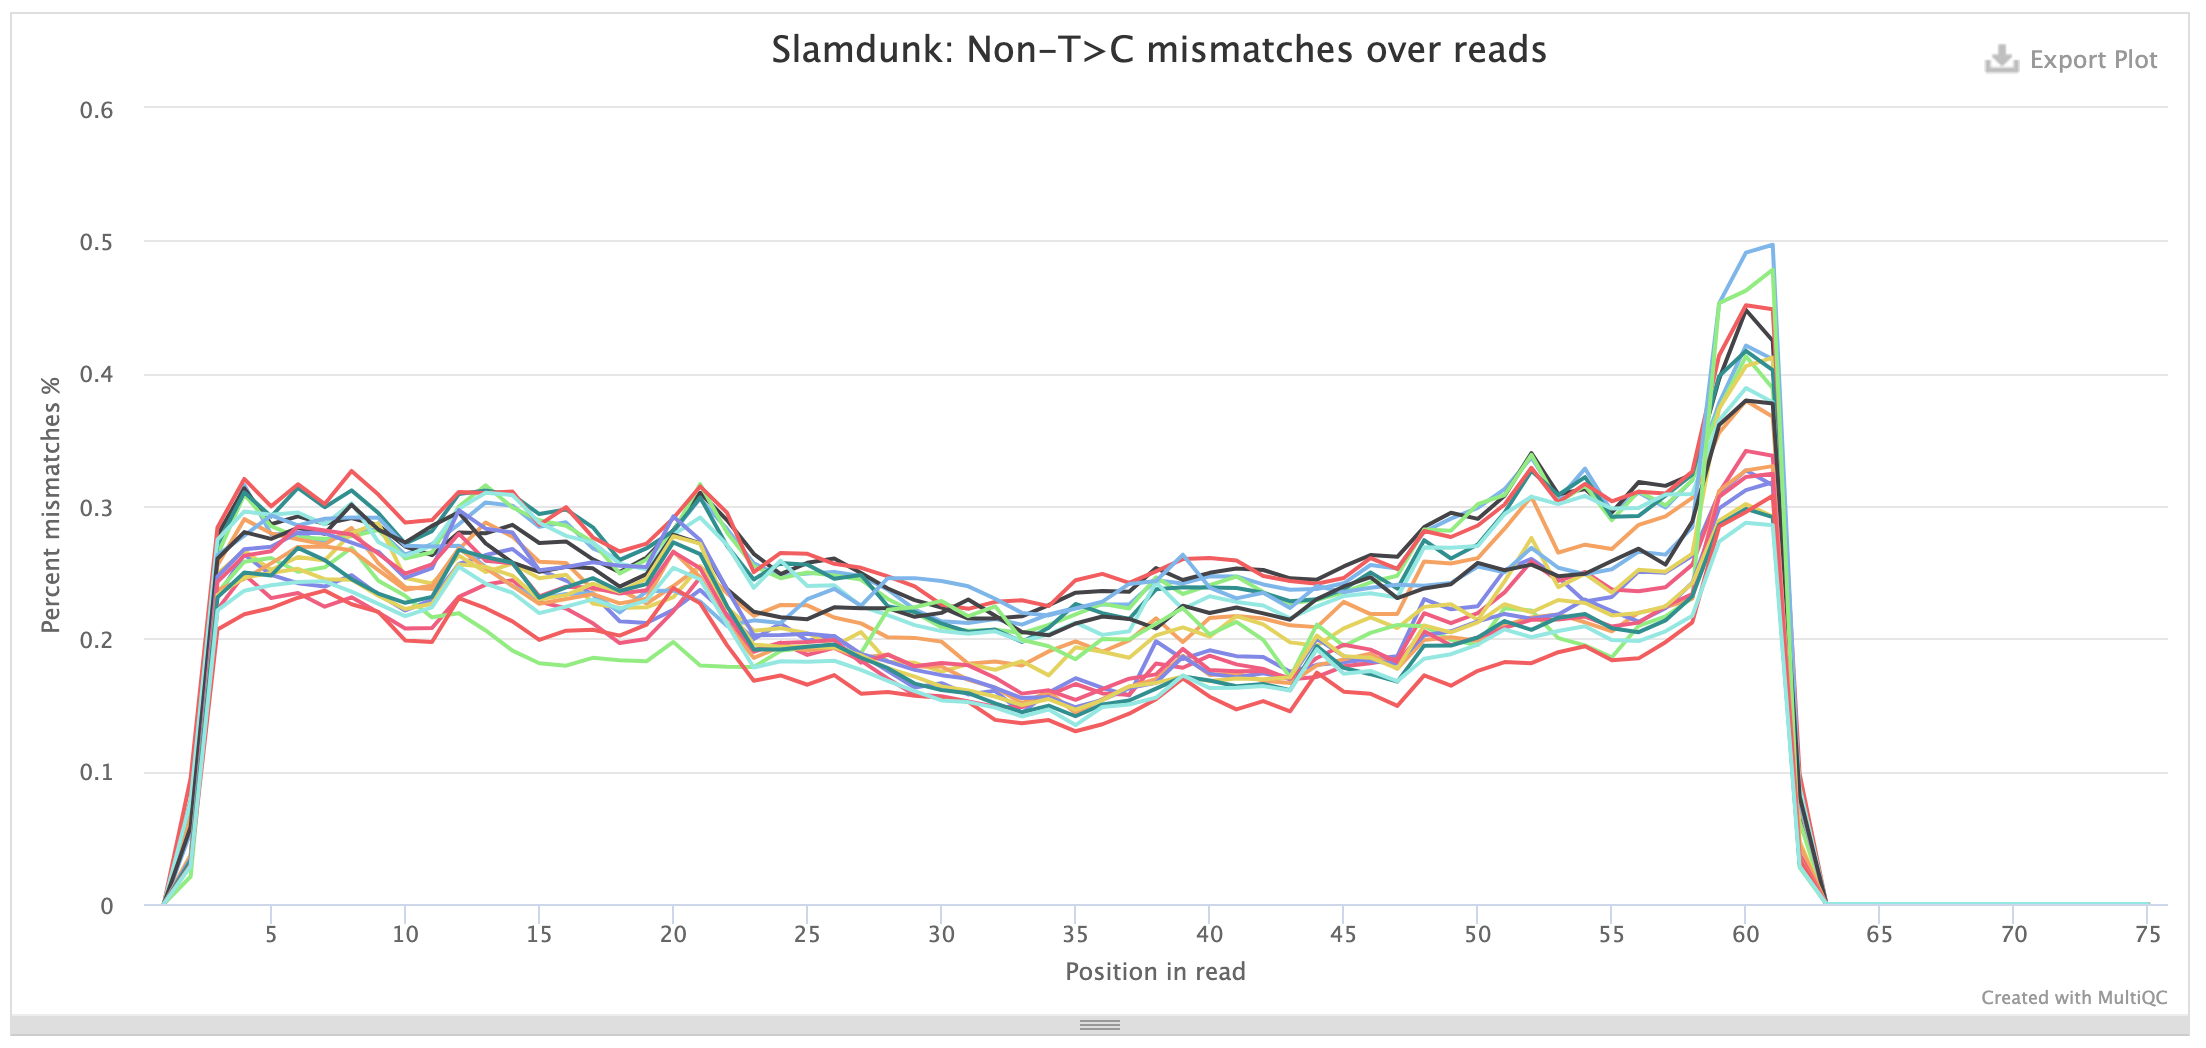
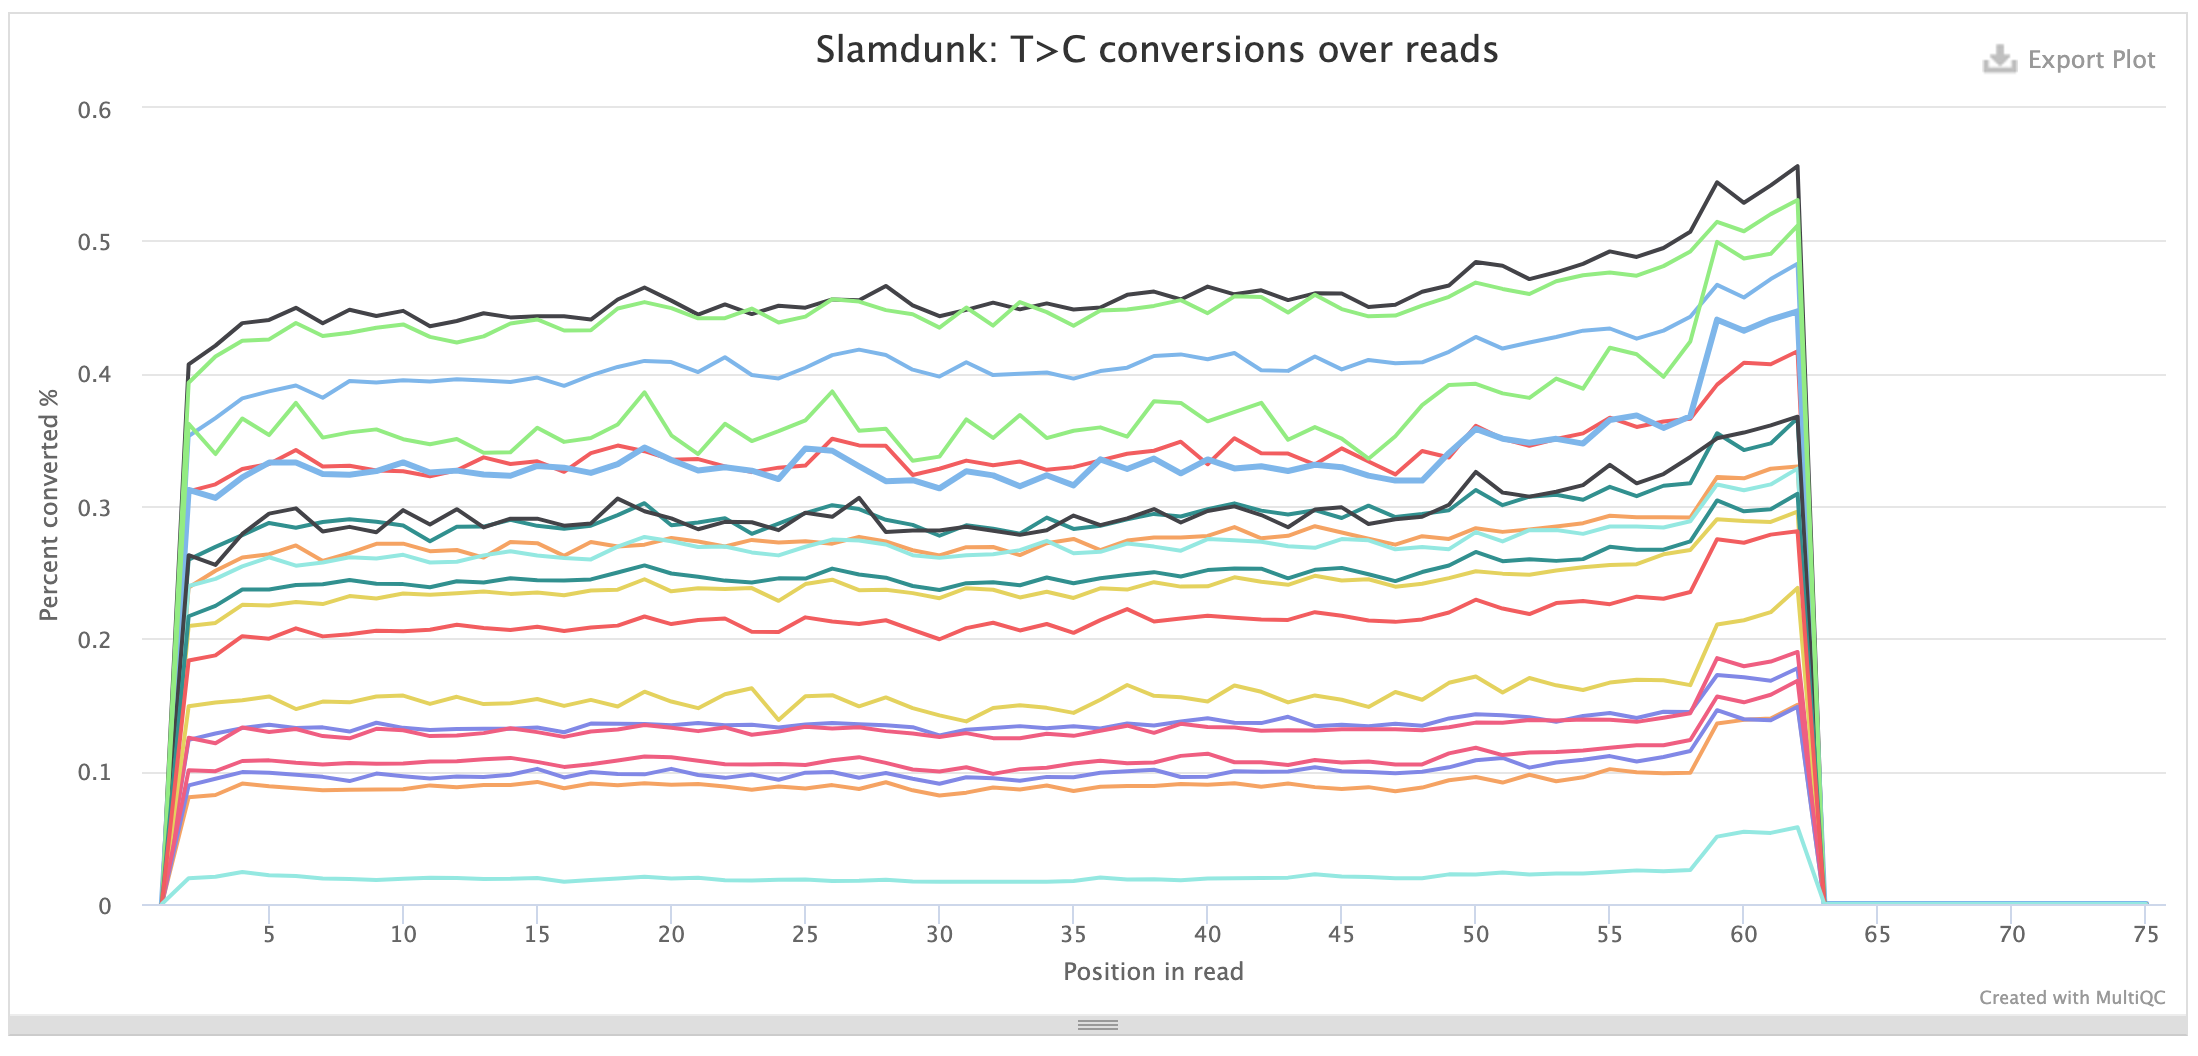
The same plots also exist for UTR positions.
Output directory: results/slamdunk
bam/*.{bam,bai}- The aligned and filtered BAM and BAI files
vcf/*.vcf- The called SNPs for filtering T>C SNPs from
slamdunk snp
- The called SNPs for filtering T>C SNPs from
count/utrs/*tsv- The total and converted read quantifications on a UTR level (format details).
count/genes/*csv- The total and converted read quantifications summarised per gene.
DESeq2
DESeq2 is used to call differential transcriptional output between conditions to infer direct transcriptional targets. The nfcore/slamseq pipeline uses the total read counts to calculate the sizeFactors and then proceeds with the converted read counts for the remaining steps of the DESeq2 workflow.
DESeq2 produces several plots, the most important ones being briefly described here:
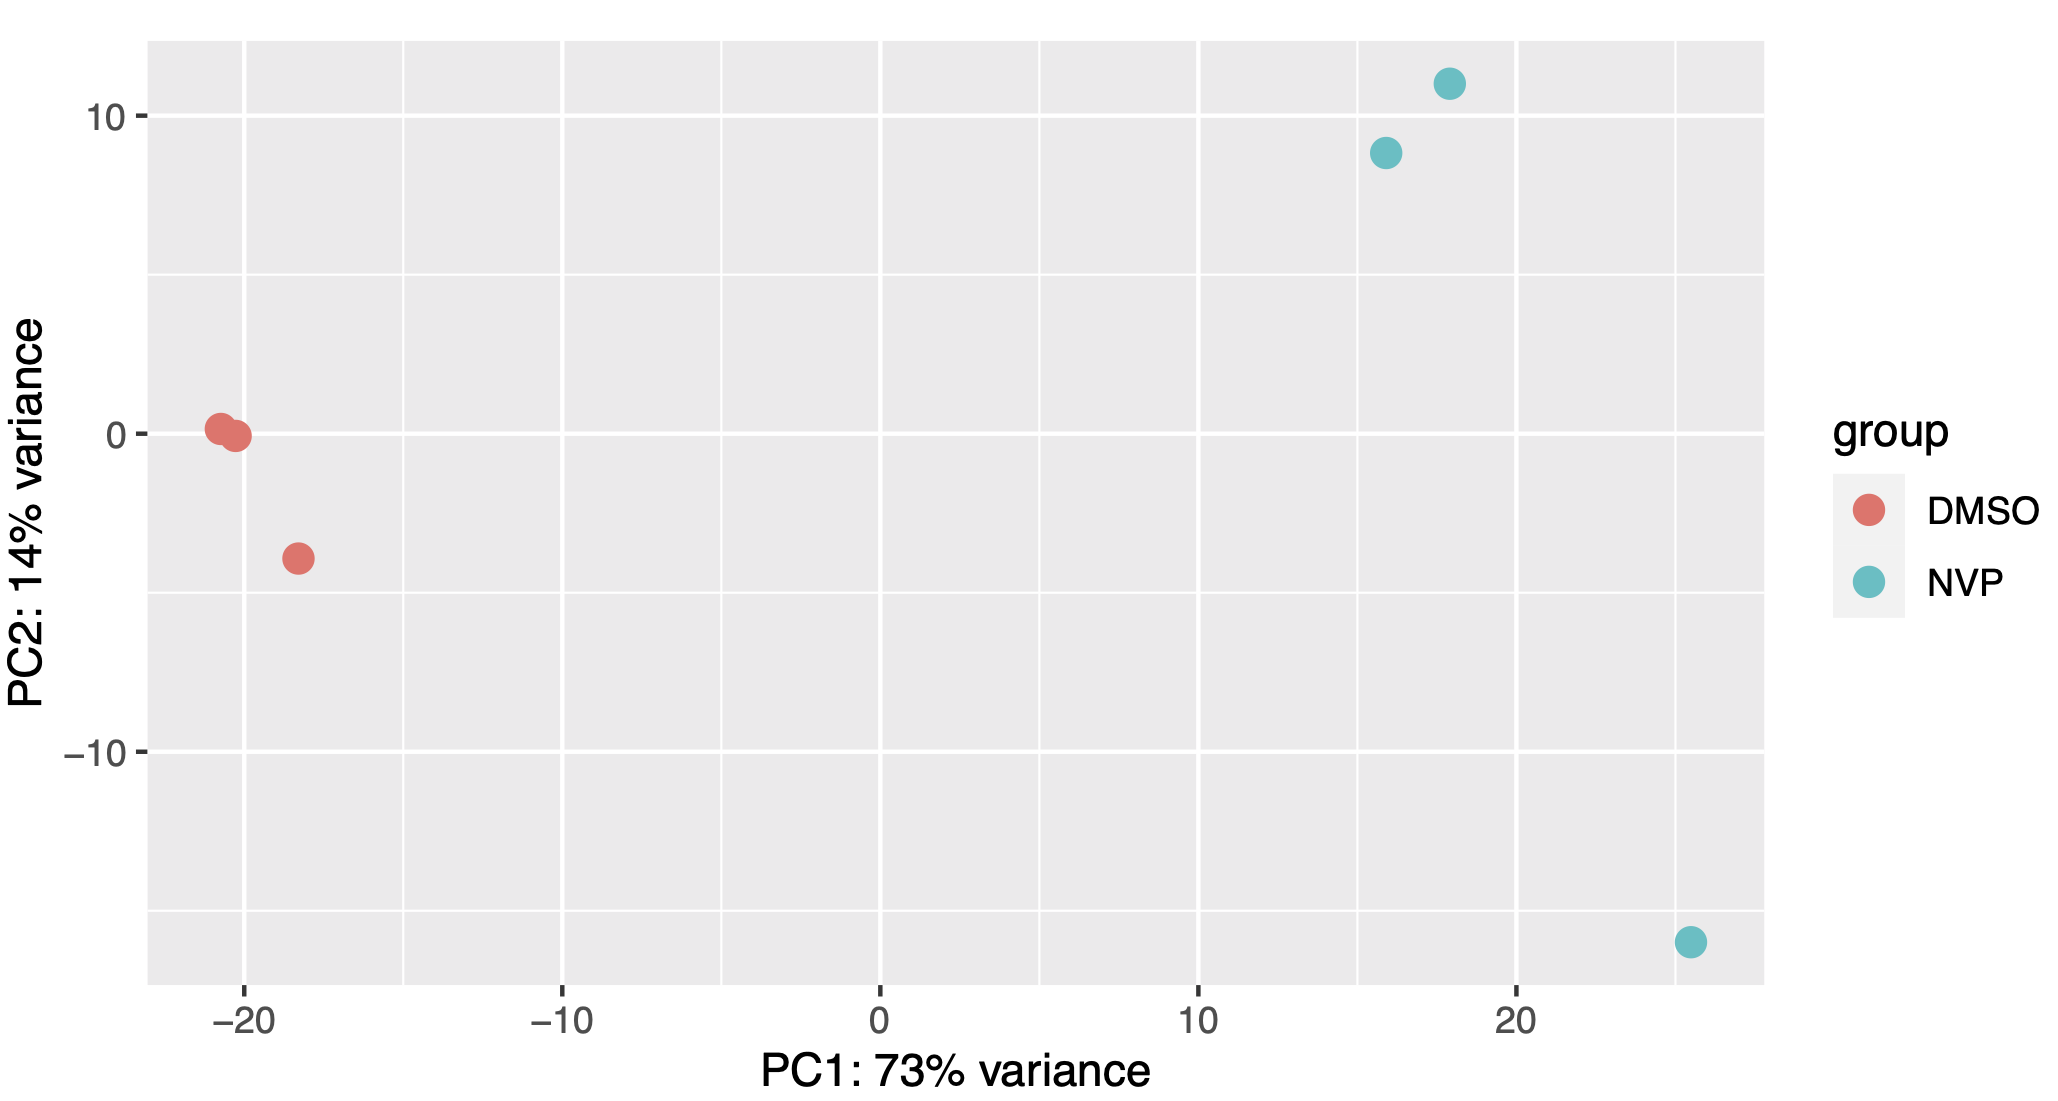
PCA:
This PCA plot is basically the function plotPCA run on the total-read normalized T>C read counts.
As with every PCA plot, your replicates should cluster together and your conditions apart.
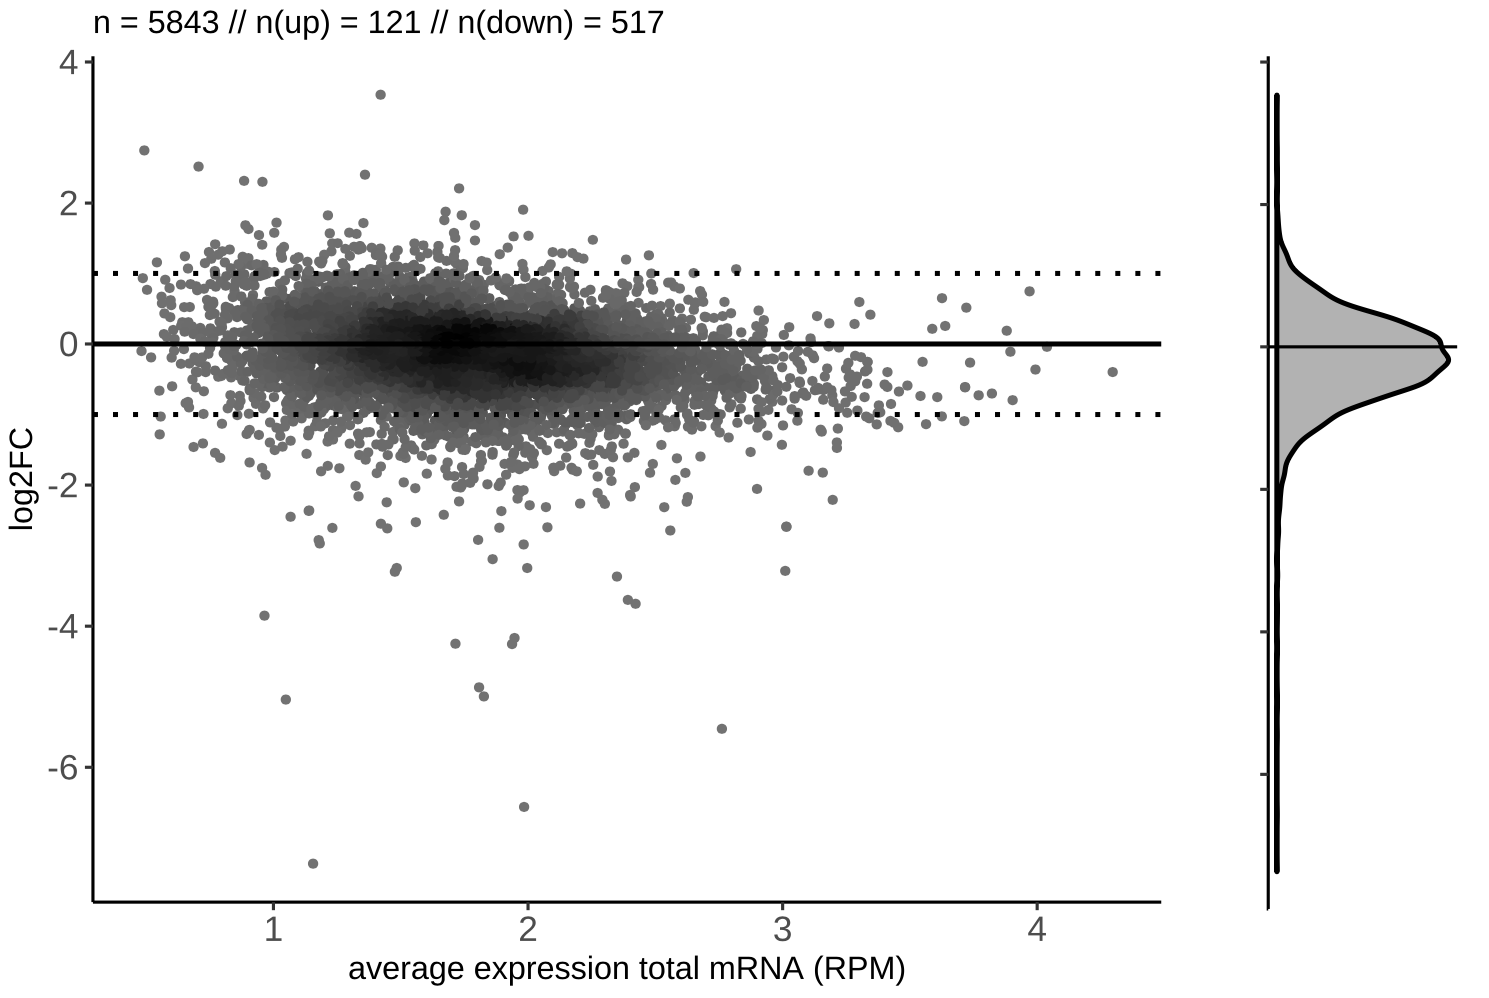
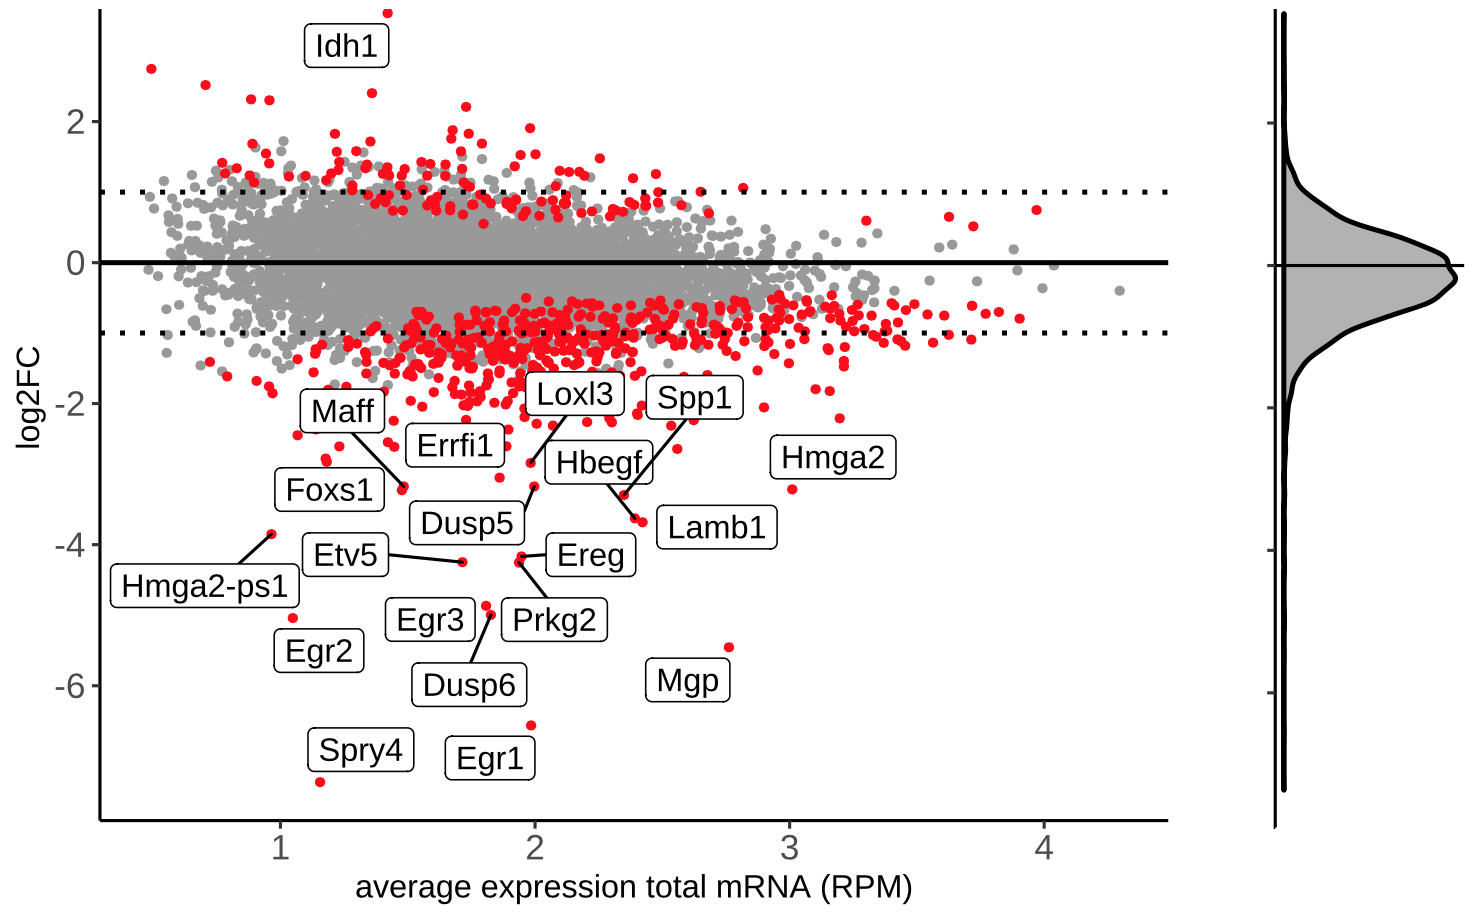
MA plot:
We produce several versions of MA plots for each contrast, the most important being a density plot for the log2-fold change distribution along the baseline expression levels in the control samples, as well as MA plots where the significant hits (specifiable by the --pvalue parameter) are highlighted and the top 20 gene names are listed. Find below a representative example of a density and highlighted MA-plot:
Output directory: results/deseq2
- Directly in the output directory you will find one subfolder per
group.
Output directory: results/deseq2/<group>
PCA.pdf- A plain PCA plot for the samples in a given group (see vignette)
- Again in each
groupfolder you will find one subfolder for a given contrast of aconditionvs the specified control condition
Output directory: results/deseq2/<group>/<condition>
DESeq2.txt- A tab-delimited text file with the DESeq2 results containing the following columns:
gene_name: Name of the gene as in--bedfilelog2FC_deseq2: The log2 fold-change ofconditionvscontrolpadj: Adjusted p-value for a given geneavg.RPM.ctrl: Average RPM of the control samples for a given gene
- A tab-delimited text file with the DESeq2 results containing the following columns:
MAPlot.pdf- MA-plot of the average RPM in control samples vs log2 fold-changes coloring significant genes exceed the p-value threshold defined in
--pvalue.
- MA-plot of the average RPM in control samples vs log2 fold-changes coloring significant genes exceed the p-value threshold defined in
MultiQC
MultiQC is a visualisation tool that generates a single HTML report summarising all samples in your project. Most of the pipeline QC results are visualised in the report and further statistics are available in within the report data directory.
The pipeline has special steps which allow the software versions used to be reported in the MultiQC output for future traceability.
Output directory: results/multiqc
Project_multiqc_report.html- MultiQC report - a standalone HTML file that can be viewed in your web browser
Project_multiqc_data/- Directory containing parsed statistics from the different tools used in the pipeline
For more information about how to use MultiQC reports, see http://multiqc.info
Pipeline information
Nextflow provides excellent functionality for generating various reports relevant to the running and execution of the pipeline. This will allow you to troubleshoot errors with the running of the pipeline, and also provide you with other information such as launch commands, run times and resource usage.
Output files:
pipeline_info/- Reports generated by Nextflow:
execution_report.html,execution_timeline.html,execution_trace.txtandpipeline_dag.dot/pipeline_dag.svg. - Reports generated by the pipeline:
pipeline_report.html,pipeline_report.txtandsoftware_versions.csv. - Documentation for interpretation of results in HTML format:
results_description.html.
- Reports generated by Nextflow: