nf-core/taxprofiler
Highly parallelised multi-taxonomic profiling of shotgun short- and long-read metagenomic data
Introduction
This document describes the output produced by the pipeline. Most of the plots are taken from the MultiQC report, which summarises results at the end of the pipeline.
The directories listed below will be created in the results directory after the pipeline has finished. All paths are relative to the top-level results directory.
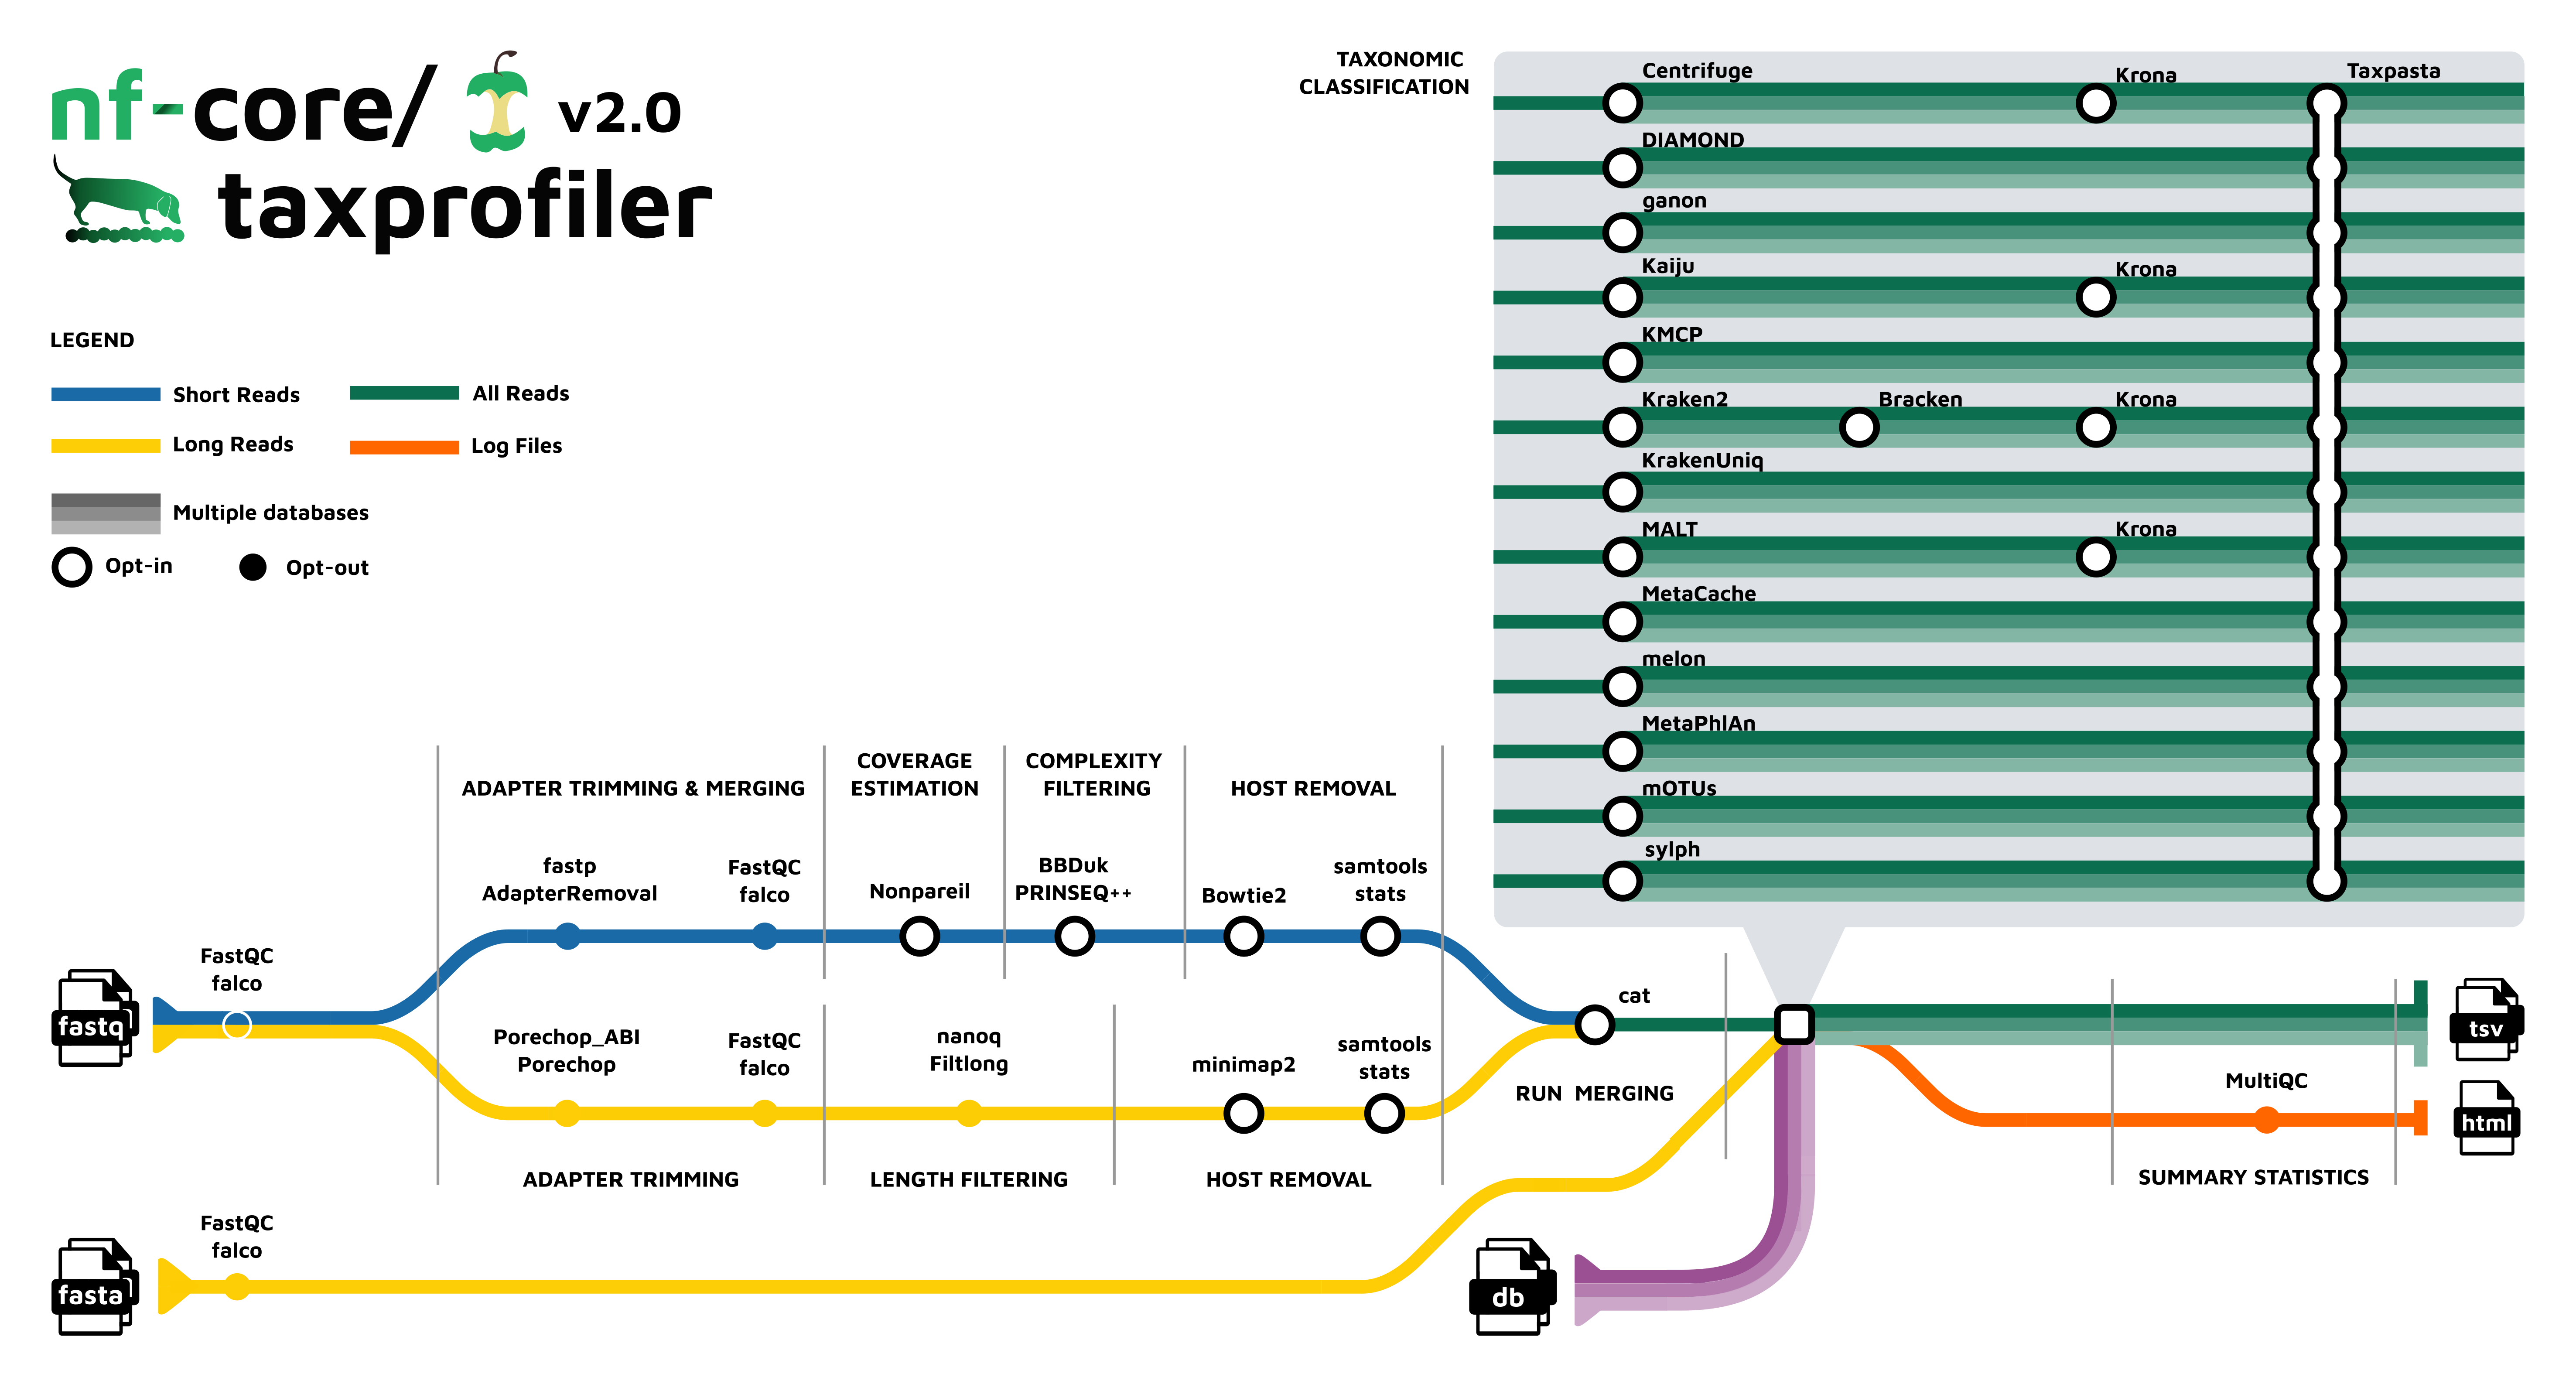
Pipeline overview
The pipeline is built using Nextflow and processes data using the following steps:
- UNTAR - Optionally saved decompressed input databases
- FastQC - Raw read QC
- falco - Alternative to FastQC for raw read QC
- fastp - Adapter trimming for Illumina data
- AdapterRemoval - Adapter trimming for Illumina data
- Nonpareil - Read redundancy and metagenome coverage estimation for short reads
- BBDuk - Quality trimming and filtering for Illumina data
- PRINSEQ++ - Quality trimming and filtering for Illunina data
- Porechop - Adapter removal for Oxford Nanopore data
- Porechop_ABI - Adapter removal for Oxford Nanopore data
- Filtlong - Quality trimming and filtering for Nanopore data
- Nanoq - Quality trimming and filtering for Nanopore data
- Bowtie2 - Host removal for Illumina reads
- minimap2 - Host removal for Nanopore reads
- SAMtools stats - Statistics from host removal
- SAMtools fastq - Converts unmapped BAM file to fastq format (minimap2 only)
- Analysis Ready Reads - Optional results directory containing the final processed reads used as input for classification/profiling.
- Bracken - Taxonomic classifier using k-mers and abundance estimations
- Kraken2 - Taxonomic classifier using exact k-mer matches
- KrakenUniq - Taxonomic classifier that combines the k-mer-based classification and the number of unique k-mers found in each species
- Centrifuge - Taxonomic classifier that uses a novel indexing scheme based on the Burrows-Wheeler transform (BWT) and the Ferragina-Manzini (FM) index.
- Kaiju - Taxonomic classifier that finds maximum (in-)exact matches on the protein-level.
- Diamond - Sequence aligner for protein and translated DNA searches.
- MALT - Sequence alignment and analysis tool designed for processing high-throughput sequencing data, especially in the context of metagenomics
- MetaPhlAn - Genome-level marker gene based taxonomic classifier
- mOTUs - Tool for marker gene-based OTU (mOTU) profiling.
- KMCP - Taxonomic classifier that utilizes genome coverage information by splitting the reference genomes into chunks and stores k-mers in a modified and optimized COBS index for fast alignment-free sequence searching.
- ganon - Taxonomic classifier and profile that uses Interleaved Bloom Filters as indices based on k-mers/minimizers.
- sylph - Taxonomic classifier that performs ultrafast average nucleotide identity (ANI) querying or metagenomic profiling for metagenomic shotgun samples.
- Melon - Taxonomic classifier that uses ribosomal marker genes to classify and quantify long-read metagenomic data.
- MetaCache - Taxonomic classifier using minhashing.
- TAXPASTA - Tool to standardise taxonomic profiles as well as merge profiles across samples from the same database and classifier/profiler.
- MultiQC - Aggregate report describing results and QC from the whole pipeline
- Pipeline information - Report metrics generated during the workflow execution
untar
untar is used in nf-core/taxprofiler to decompress various input files ending in .tar.gz. This process is mainly used for decompressing input database archive files.
Output files
untar/database/<database_file_name>: directory containing contents of the decompressed archive
This directory will only be present if --save_untarred_databases is supplied. The contained directories can be useful for moving the decompressed directories to a central ‘cache’ location allowing users to re-use the same databases. This is useful to save unnecessary computational time of decompressing the archives on every run.
FastQC or Falco
Output files
{fastqc,falco}/- {raw,preprocessed}
*html: FastQC or Falco report containing quality metrics in HTML format.*.txt: FastQC or Falco report containing quality metrics in TXT format.*.zip: Zip archive containing the FastQC report, tab-delimited data file and plot images (FastQC only).
- {raw,preprocessed}
FastQC gives general quality metrics about your sequenced reads. It provides information about the quality score distribution across your reads, per base sequence content (%A/T/G/C), adapter contamination and overrepresented sequences. For further reading and documentation see the FastQC help pages.
If preprocessing is turned on, nf-core/taxprofiler runs FastQC/Falco twice -once before and once after adapter removal/read merging, to allow evaluation of the performance of these preprocessing steps. Note in the General Stats table, the columns of these two instances of FastQC/Falco are placed next to each other to make it easier to evaluate. However, the columns of the actual preprocessing steps (i.e, fastp, AdapterRemoval, and Porechop) will be displayed after the two FastQC/Falco columns, even if they were run ‘between’ the two FastQC/Falco jobs in the pipeline itself.
Falco produces identical output to FastQC but in the falco/ directory.
fastp
fastp is a FASTQ pre-processing tool for quality control, trimmming of adapters, quality filtering and other features.
It is used in nf-core/taxprofiler for adapter trimming of short-reads.
Output files
fastp/<sample_id>.fastp.fastq.gz: File with the trimmed unmerged fastq reads.<sample_id>.merged.fastq.gz: File with the reads that were successfully merged.<sample_id>.*{log,html,json}: Log files in different formats.
By default nf-core/taxprofiler will only provide the <sample_id>.fastp.fastq.gz file if fastp is selected. The file <sample_id>.merged.fastq.gz will be available in the output folder if you provide the argument --shortread_qc_mergepairs (optionally retaining un-merged pairs when in combination with --shortread_qc_includeunmerged).
You can change the default value for low complexity filtering by using the argument --shortread_complexityfilter_fastp_threshold.
AdapterRemoval
AdapterRemoval searches for and removes remnant adapter sequences from High-Throughput Sequencing (HTS) data and (optionally) trims low quality bases from the 3’ end of reads following adapter removal. It is popular in the field of palaeogenomics. The output logs are stored in the results folder, and as a part of the MultiQC report.
Output files
adapterremoval/<sample_id>.settings: AdapterRemoval log file containing general adapter removal, read trimming and merging statistics<sample_id>.collapsed.fastq.gz- read-pairs that merged and did not undergo trimming (only when--shortread_qc_mergepairssupplied)<sample_id>.collapsed.truncated.fastq.gz- read-pairs that merged underwent quality trimming (only when--shortread_qc_mergepairssupplied)<sample_id>.pair1.truncated.fastq.gz- read 1 of pairs that underwent quality trimming<sample_id>.pair2.truncated.fastq.gz- read 2 of pairs that underwent quality trimming (and could not merge if--shortread_qc_mergepairssupplied)<sample_id>.singleton.truncated.fastq.gz- orphaned read pairs where one of the pair was discarded<sample_id>.discard.fastq.gz- reads that were discarded due to length or quality filtering
By default nf-core/taxprofiler will only provide the .settings file if AdapterRemoval is selected.
You will only find the .fastq files in the results directory if you provide --save_preprocessed_reads. If this is selected, you may receive different combinations of .fastq files for each sample depending on the input types - e.g. whether you have merged or not, or if you’re supplying both single- and paired-end reads. Alternatively, if you wish only to have the ‘final’ reads that go into classification/profiling (i.e., that may have additional processing), do not specify this flag but rather specify --save_analysis_ready_fastqs, in which case the reads will be in the folder analysis_ready_reads.
The resulting .fastq files may not always be the ‘final’ reads that go into taxprofiling, if you also run other steps such as complexity filtering, host removal, run merging etc..
Nonpareil
nonpareil is a tool for estimating metagenome ‘coverage’ from short-read libraries, i.e, whether all genomes within the metagenome have had at least one read sequenced. The lower the redundancy, the more sequencing can be done until the entire metagenome has been captured. The output can be used to guide the amount of further sequencing is required.
Output files
-
nonpareil/<sample_id>.npl- log file of the nonpareil run.<sample_id>.npo- redundancy summary file. This is the most useful file and contains the information for generating metagenome coverage curves. These six columns are: seq. effort (n reads), average redundancy, standard deviation, quartile 1, median (quartile 2), and quartile 3.<sample_id>.npa- raw version of npo but with all replicates not just a summary (average) at each point. These three columns are: seq. effort (n reads), replicate ID, redundancy value.<sample_id>.npc- raw list with the number of reads in the dataset matching a query read.<sample_id>.png- rendered version of a Nonpareil curve, with extrapolation and sequencing effort information.nonpareil_all_samples_mqc.{png,pdf}summary of the plot of curves for all samples with sequencing effort information.nonpareil_all_samples_mqc.{json,tsv,csv}basic summary statistics of model, with additional curve and plotting information in the JSON.
In most cases you will just want to look at the PNG files which contain the extrapolation information for estimating how much of the metagenome ‘coverage’ you will recover if you sequence more (i.e., to help indicate at what point you will just keep sequencing redundant reads that provide no more new taxonomic information).
The .npo files can be used for re-generating and customising the plots using the companion Nonpareil R package.
Porechop
Porechop is a tool for finding and removing adapters from Oxford Nanopore reads. Adapters on the ends of reads are trimmed and if a read has an adapter in its middle, it is considered a chimeric and it chopped into separate reads.
Output files
porechop/<sample_id>.log: Log file containing trimming statistics<sample_id>.fastq.gz: Adapter-trimmed file
The output logs are saved in the output folder and are part of MultiQC report.You do not normally need to check these manually.
You will only find the .fastq files in the results directory if you provide --save_preprocessed_reads. Alternatively, if you wish only to have the ‘final’ reads that go into classification/profiling (i.e., that may have additional processing), do not specify this flag but rather specify --save_analysis_ready_fastqs, in which case the reads will be in the folder analysis_ready_reads.
We do not recommend using Porechop if you are already trimming the adapters with ONT’s basecaller Guppy.
Porechop_ABI
Porechop_ABI is an extension of Porechop. Unlike Porechop, Porechop_ABI does not use any external knowledge or database for the adapters. Adapters are discovered directly from the reads using approximate k-mers counting and assembly. Then these sequences can be used for trimming, using all standard Porechop options. The software is able to report a combination of distinct sequences if a mix of adapters is used. It can also be used to check whether a dataset has already been trimmed out or not, or to find leftover adapters in datasets that have been previously processed with Guppy.
Output files
porechop_abi/<sample_id>.log: Log file containing trimming statistics<sample_id>.fastq.gz: Adapter-trimmed file
The output logs are saved in the output folder and are part of MultiQC report.You do not normally need to check these manually.
You will only find the .fastq files in the results directory if you provide --save_preprocessed_reads. Alternatively, if you wish only to have the ‘final’ reads that go into classification/profiling (i.e., that may have additional processing), do not specify this flag but rather specify --save_analysis_ready_fastqs, in which case the reads will be in the folder analysis_ready_reads.
BBDuk
BBDuk stands for Decontamination Using Kmers. BBDuk was developed to combine most common data-quality-related trimming, filtering, and masking operations into a single high-performance tool.
It is used in nf-core/taxprofiler for complexity filtering using different algorithms. This means that it will remove reads with low sequence diversity (e.g. mono- or dinucleotide repeats).
Output files
bbduk/<sample_id>.bbduk.log: log file containing filtering statistics<sample_id>.fastq.gz: resulting FASTQ file without low-complexity reads
By default nf-core/taxprofiler will only provide the .log file if BBDuk is selected as the complexity filtering tool. You will only find the complexity filtered reads in your results directory if you provide --save_complexityfiltered_reads. Alternatively, if you wish only to have the ‘final’ reads that go into classification/profiling (i.e., that may have additional processing), do not specify this flag but rather specify --save_analysis_ready_fastqs, in which case the reads will be in the folder analysis_ready_reads.
The resulting .fastq files may not always be the ‘final’ reads that go into taxprofiling, if you also run other steps such as host removal, run merging etc..
PRINSEQ++
PRINSEQ++ is a C++ implementation of the prinseq-lite.pl program. It can be used to filter, reformat or trim genomic and metagenomic sequence data.
It is used in nf-core/taxprofiler for complexity filtering using different algorithms. This means that it will remove reads with low sequence diversity (e.g. mono- or dinucleotide repeats).
Output files
prinseqplusplus/<sample_id>.log: log file containing number of reads. Row IDs correspond to:min_len, max_len, min_gc, max_gc, min_qual_score, min_qual_mean, ns_max_n, noiupac, derep, lc_entropy, lc_dust, trim_tail_left, trim_tail_right, trim_qual_left, trim_qual_right, trim_left, trim_right<sample_id>_good_out.fastq.gz: resulting FASTQ file without low-complexity reads
By default nf-core/taxprofiler will only provide the .log file if PRINSEQ++ is selected as the complexity filtering tool. You will only find the complexity filtered .fastq files in your results directory if you supply --save_complexityfiltered_reads. Alternatively, if you wish only to have the ‘final’ reads that go into classification/profiling (i.e., that may have additional processing), do not specify this flag but rather specify --save_analysis_ready_fastqs, in which case the reads will be in the folder analysis_ready_reads.
The resulting .fastq files may not always be the ‘final’ reads that go into taxprofiling, if you also run other steps such as host removal, run merging etc..
Filtlong
Filtlong is a quality filtering tool for long reads. It can take a set of small reads and produce a smaller, better subset.
Output files
filtlong/<sample_id>_filtered.fastq.gz: Quality or long read data filtered file<sample_id>_filtered.log: log file containing summary statistics
You will only find the .fastq files in the results directory if you provide --save_preprocessed_reads. Alternatively, if you wish only to have the ‘final’ reads that go into classification/profiling (i.e., that may have additional processing), do not specify this flag but rather specify --save_analysis_ready_fastqs, in which case the reads will be in the folder analysis_ready_reads.
We do not recommend using Filtlong if you are performing filtering of low quality reads with ONT’s basecaller Guppy.
Nanoq
nanoq is an ultra-fast quality filtering tool that also provides summary reports for nanopore reads.
Output files
nanoq/<sample_id>_filtered.fastq.gz: Quality or long read data filtered file<sample_id>_filtered.stats: Summary statistics report
You will only find the .fastq files in the results directory if you provide --save_preprocessed_reads. Alternatively, if you wish only to have the ‘final’ reads that go into classification/profiling (i.e., that may have additional processing), do not specify this flag but rather specify --save_analysis_ready_fastqs, in which case the reads will be in the folder analysis_ready_reads.
Bowtie2
Bowtie 2 is an ultrafast and memory-efficient tool for aligning sequencing reads to long reference sequences. It is particularly good at aligning reads of about 50 up to 100s or 1,000s of characters, and particularly good at aligning to relatively long (e.g. mammalian) genomes.
It is used with nf-core/taxprofiler to allow removal of ‘host’ (e.g. human) and/or other possible contaminant reads (e.g. Phi X) from short-read .fastq files prior to profiling.
Output files
bowtie2/build/*.bt2: Bowtie2 indices of reference genome, only if--save_hostremoval_indexsupplied.
align/<sample_id>.bam: Alignment file in BAM format containing both mapped and unmapped reads (only if--save_hostremoval_bamsupplied).<sample_id>.bai: Index file in BAI format containing both mapped and unmapped reads (only if--save_hostremoval_bamsupplied).<sample_id>.bowtie2.log: log file about the mapped reads<sample_id>.unmapped.fastq.gz: the off-target reads from the mapping that is used in downstream steps (only if--save_hostremoval_unmappedsupplied).
By default nf-core/taxprofiler will only provide the .log file if host removal is turned on. You will only have a .bam file if you specify --save_hostremoval_bam. This will contain both mapped and unmapped reads. You will only get FASTQ files if you specify to save --save_hostremoval_unmapped - these contain only unmapped reads. Alternatively, if you wish only to have the ‘final’ reads that go into classification/profiling (i.e., that may have additional processing), do not specify this flag but rather specify --save_analysis_ready_fastqs, in which case the reads will be in the folder analysis_ready_reads.
Unmapped reads in FASTQ are only found in this directory for short-reads, for long-reads see samtools/fastq/.
The resulting .fastq files may not always be the ‘final’ reads that go into taxprofiling, if you also run other steps such as run merging etc..
While there is a dedicated section in the MultiQC HTML for Bowtie2, these values are not displayed by default in the General Stats table. Rather, alignment statistics to host genome is reported via samtools stats module in MultiQC report for direct comparison with minimap2 (see below).
minimap2
minimap2 is an alignment tool suited to mapping long reads to reference sequences.
It is used with nf-core/taxprofiler to allow removal of ‘host’ (e.g. human) or other possible contaminant reads from long-read .fastq files prior to taxonomic classification/profiling.
Output files
minimap2/build/*.mmi2: minimap2 indices of reference genome, only if--save_hostremoval_indexsupplied.
align/<sample_id>.bam: Alignment file in BAM format containing both mapped and unmapped reads (only if--save_hostremoval_bamsupplied).<sample_id>.bai: Index file in BAI format containing both mapped and unmapped reads (only if--save_hostremoval_bamsupplied).
By default, nf-core/taxprofiler will only provide the .bam file containing mapped and unmapped reads if saving of host removal for long reads is turned on via --save_hostremoval_bam.
minimap2 is not yet supported as a module in MultiQC and therefore there is no dedicated section in the MultiQC HTML. Rather, alignment statistics to host genome is reported via samtools stats module in MultiQC report.
Unlike Bowtie2, minimap2 does not produce an unmapped FASTQ file by itself. See samtools/fastq.
SAMtools fastq
SAMtools fastq converts a .sam, .bam, or .cram alignment file to FASTQ format
Output files
samtools/stats/<sample_id>_interleaved.fq.gz: Unmapped reads only in FASTQ gzip format
This directory will be present and contain the unmapped reads from the .fastq format from long-read minimap2 host removal, if --save_hostremoval_unmapped is supplied. Alternatively, if you wish only to have the ‘final’ reads that go into classification/profiling (i.e., that may have additional processing), do not specify this flag but rather specify --save_analysis_ready_fastqs, in which case the reads will be in the folder analysis_ready_reads.
For short-read unmapped reads, see bowtie2.
Analysis Ready Reads
This optional results directory will only be present in the pipeline results when supplying --save_analysis_ready_fastqs.
Output files
analysis_ready_fastqs/<sample_id>_{fq,fastq}.gz: Final reads that underwent preprocessing and were sent for classification/profiling.
The results directory will contain the ‘final’ processed reads used as input for classification/profiling. It will only include the output of the last step of any combinations of preprocessing steps that may have been specified in the run configuration. For example, if you perform the read QC and host-removal preprocessing steps, the final reads that are sent to classification/profiling are the host-removed FASTQ files - those will be the ones present in this directory.
If you turn off all preprocessing steps, then no results will be present in this directory. This happens independently for short- and long-reads. I.e. you will only have FASTQ files for short reads in this directory if you skip all long-read preprocessing.
SAMtools stats
SAMtools stats collects statistics from a .sam, .bam, or .cram alignment file and outputs in a text format.
Output files
samtools/stats/<sample_id>.stats: File containing samtools stats output.
In most cases you do not need to check this file, as it is rendered in the MultiQC run report.
Run Merging
nf-core/taxprofiler offers the option to merge FASTQ files of multiple sequencing runs or libraries that derive from the same sample, as specified in the input samplesheet.
This is the last possible preprocessing step, so if you have multiple runs or libraries (and run merging turned on), this will represent the final reads that will go into classification/profiling steps.
Output files
run_merging/*.fastq.gz: Concatenated FASTQ files on a per-sample basis
Note that you will only find samples that went through the run merging step in this directory. For samples that had a single run or library will not go through this step of the pipeline and thus will not be present in this directory.
This directory and its FASTQ files will only be present if you supply --save_runmerged_reads. Alternatively, if you wish only to have the ‘final’ reads that go into classification/profiling (i.e., that may have additional processing), do not specify this flag but rather specify --save_analysis_ready_fastqs, in which case the reads will be in the folder analysis_ready_reads.
Bracken
Bracken (Bayesian Reestimation of Abundance with Kraken) is a highly accurate statistical method that computes the abundance of species in DNA sequences from a metagenomics sample. Braken uses the taxonomy labels assigned by Kraken, a highly accurate metagenomics classification algorithm, to estimate the number of reads originating from each species present in a sample.
The first step of using Bracken requires running Kraken2, therefore the initial results before abundance estimation will be found in <your_results>/kraken2/<your_bracken_db_name>.
Output files
bracken/<db_name>/bracken_<db_name>_combined_reports.txt: combined bracken results as output from Bracken’scombine_bracken_outputs.pyscript<db_name>/<sample>_<db_name>.tsv: TSV file containing per-sample summary of Bracken results with abundance information<sample>_<db_name>.report_bracken_species.txt: Kraken2 style report with Bracken abundance information
The main taxonomic profiling file from Bracken is the *.tsv file. This provides the basic results from Kraken2 but with the corrected abundance information. Note that the raw Kraken2 version of the upstream step of Bracken can be found in the kraken2/ directory with the suffix of <sample_id>_<db_name>.bracken.report.txt (with a 6 column variant when --save_minimizers specified).
Kraken2
Kraken is a taxonomic sequence classifier that assigns taxonomic labels to DNA sequences. Kraken examines the k-mers within a query sequence and uses the information within those k-mers to query a database. That database maps -mers to the lowest common ancestor (LCA) of all genomes known to contain a given k-mer.
Output files
kraken2/<db_name>_combined_reports.txt: A combined profile of all samples aligned to a given database (as generated bykrakentools)- If you have also run Bracken, the original Kraken report (i.e., before read re-assignment) will also be included in this directory with
-brackensuffixed to your Bracken database name if you supply--bracken_save_intermediatekraken2to the run. For example:kraken2-<mydatabase>-bracken.tsv. However in most cases you want to use the actual Bracken file (i.e.,bracken_<mydatabase>.tsv).
- If you have also run Bracken, the original Kraken report (i.e., before read re-assignment) will also be included in this directory with
<db_name>/<sample_id>_<db_name>.classified.fastq.gz: FASTQ file containing all reads that had a hit against a reference in the database for a given sample<sample_id>_<db_name>.unclassified.fastq.gz: FASTQ file containing all reads that did not have a hit in the database for a given sample<sample_id>_<db_name>.<kraken2/bracken2>report.txt: A Kraken2 report that summarises the fraction abundance, taxonomic ID, number of Kmers, taxonomic path of all the hits in the Kraken2 run for a given sample. Will be 6 column rather than 8 if--save_minimizersspecified. This report will only be included if you supply--bracken_save_intermediatekraken2to the run.<sample_id>_<db_name>.classifiedreads.txt: A list of read IDs and the hits each read had against each database for a given sample
The main taxonomic classification file from Kraken2 is the _combined_reports.txt or *report.txt file. The former provides you the broadest over view of the taxonomic classification results across all samples against a single database, where you get two columns for each sample e.g. 2_all and 2_lvl, as well as a summarised column summing up across all samples tot_all and tot_lvl. The latter gives you the most information for a single sample. The report file is also used for the taxpasta step.
You will only receive the .fastq and *classifiedreads.txt file if you supply --kraken2_save_reads and/or --kraken2_save_readclassifications parameters to the pipeline.
When running Bracken, you will only get the ‘intermediate’ Kraken2 report files in this directory if you supply --bracken_save_intermediatekraken2 to the run.
KrakenUniq
KrakenUniq (formerly KrakenHLL) is an extension to the fast k-mer-based classification performed by Kraken with an efficient algorithm for additionally assessing the coverage of unique k-mers found in each species in a dataset.
Output files
krakenuniq/<db_name>/<sample_id>_<db_name>[.merged].classified.fast{a,q}.gz: Optional FASTA file containing all reads that had a hit against a reference in the database for a given sample. Paired-end input reads are merged in this output.<sample_id>_<db_name>[.merged].unclassified.fast{a,q}.gz: Optional FASTA file containing all reads that did not have a hit in the database for a given sample. Paired-end input reads are merged in this output.<sample_id>_<db_name>.krakenuniq.report.txt: A Kraken2-style report that summarises the fraction abundance, taxonomic ID, number of Kmers, taxonomic path of all the hits, with an additional column for k-mer coverage, that allows for more accurate distinguishing between false-positive/true-postitive hits.<sample_id>_<db_name>.krakenuniq.classified.txt: An optional list of read IDs and the hits each read had against each database for a given sample.
The main taxonomic classification file from KrakenUniq is the *.krakenuniq.report.txt file. This is an extension of the Kraken2 report with the additional k-mer coverage information that provides more information about the accuracy of hits.
You will only receive the .fasta.gz and *.krakenuniq.classified.txt file if you supply --krakenuniq_save_reads and/or --krakenuniq_save_readclassification parameters to the pipeline.
The output system of KrakenUniq can result in other stdout or stderr logging information being saved in the report file, therefore you must check your report files before downstream use!
Centrifuge
Centrifuge is a taxonomic sequence classifier that uses a Burrows-Wheeler transform and Ferragina-Manzina index for storing and mapping sequences.
Output files
centrifuge/<db_name>/<sample_id>.centrifuge.mapped.fastq.gz:FASTQfiles containing all mapped reads<sample_id>.centrifuge.report.txt: A classification report that summarises the taxonomic ID, the taxonomic rank, length of genome sequence, number of classified and uniquely classified reads<sample_id>.centrifuge.results.txt: A file that summarises the classification assignment for a read, i.e read ID, sequence ID, score for the classification, score for the next best classification, number of classifications for this read<sample_id>.centrifuge.txt: A Kraken2-style report that summarises the fraction abundance, taxonomic ID, number of k-mers, taxonomic path of all the hits in the centrifuge run for a given sample<sample_id>.centrifuge.unmapped.fastq.gz: FASTQ file containing all unmapped reads
The main taxonomic classification files from Centrifuge are the _combined_reports.txt, *report.txt, *results.txt and the *centrifuge.txt. The latter is used by the taxpasta step. You will receive the .fastq files if you supply --centrifuge_save_reads.
Kaiju
Kaiju is a taxonomic classifier that finds maximum exact matches on the protein-level using the Burrows-Wheeler transform.
Output files
kaiju/kaiju_<db_name>_combined_reports.txt: A combined profile of all samples aligned to a given database (as generated by kaiju2table)<db_name>/<sample_id>_<db_name>.kaiju.tsv: Raw output from Kaiju with taxonomic rank, read ID and taxonic ID<sample_id>_<db_name>.kaijutable.txt: Summarised Kaiju output with fraction abundance, taxonomic ID, number of reads, and taxonomic names (as generated bykaiju2table)
The most useful summary file is the _combined_reports.txt file which summarises hits across all reads and samples. Separate per-sample versions summaries can be seen in <db>/*.txt. However if you wish to look at more precise information on a per-read basis, see the *tsv file. The default taxonomic rank is species. You can provide a different one by updating the argument --kaiju_taxon_rank.
DIAMOND
DIAMOND is a sequence aligner for translated DNA searches or protein sequences against a protein reference database such as NR. It is a replacement for the NCBI BLAST software tools.It has many key features and it is used as taxonomic classifier in nf-core/taxprofiler.
Output files
diamond/<db_name>/<sample_id>.log: A log file containing stdout information<sample_id>*.{blast,xml,txt,daa,sam,tsv,paf}: A file containing alignment information in various formats, or taxonomic information in a text-based format. Exact output depends on user choice.
By default you will receive a TSV output. Alternatively, you will receive a *.sam file if you provide the parameter --diamond_save_reads but in this case no taxonomic classification will be available(!), only the aligned reads in sam format.
DIAMOND has many output formats, so depending on your choice with --diamond_output_format you will receive the taxonomic information in a different format.
MALT
MALT is a fast replacement for BLASTX, BLASTP and BLASTN, and provides both local and semi-global alignment capabilities.
Output files
malt/<db_name>/<sample_id>.blastn.sam: sparse SAM file containing alignments of each hit<sample_id>.megan: summary file that can be loaded into the MEGAN6 interactive viewer. Generated by MEGAN6 companion toolrma2info<sample_id>.rma6: binary file containing all alignments and taxonomic information of hits that can be loaded into the MEGAN6 interactive viewer<sample_id>.txt.gz: text file containing taxonomic IDs and read counts against each taxon. Generated by MEGAN6 companion toolrma2info
The main output of MALT is the .rma6 file format, which can be only loaded into MEGAN and it’s related tools. We provide the rma2info text files for improved compatibility with spreadsheet programs and other programmtic data manipulation tools, however this has only limited information compared to the ‘binary’ RMA6 file format (the .txt file only contains taxonomic ID and count, whereas RMA6 has taxonomic lineage information).
You will only receive the .sam and .megan files if you supply --malt_save_reads and/or --malt_generate_megansummary parameters to the pipeline.
MetaPhlAn
MetaPhlAn is a computational tool for profiling the composition of microbial communities (Bacteria, Archaea and Eukaryotes) from metagenomic shotgun sequencing data (i.e. not 16S) with species-level resolution via marker genes.
Output files
metaphlan/metaphlan_<db_name>_combined_reports.txt: A combined profile of all samples aligned to a given database (as generated bymetaphlan_merge_tables)<db_name>/<sample_id>.biom: taxonomic profile in BIOM format<sample_id>.bowtie2out.txt: BowTie2 alignment information (can be re-used for skipping alignment when re-running MetaPhlAn with different parameters)<sample_id>_profile.txt: MetaPhlAn taxonomic profile including abundance estimates
The output contains a file named *_combined_reports.txt, which provides an overview of the classification results for all samples. The main taxonomic profiling file from MetaPhlAn is the *_profile.txt file. This provides the abundance estimates from MetaPhlAn however does not include raw counts by default. Additionally, it contains intermediate Bowtie2 output .bowtie2out.txt, which presents a condensed representation of the mapping results of your sequencing reads to MetaPhlAn’s marker gene sequences. The alignments are listed in tab-separated columns, including Read ID and Marker Gene ID, with each alignment represented on a separate line.
mOTUs
mOTUS is a taxonomic profiler that maps reads to a unique marker specific database and estimates the relative abundance of known and unknown species.
Output files
motus/<db_name>/<sample_id>.log: A log file that contains summary statistics<sample_id>.out: A classification file that summarises taxonomic identifiers, by default at the rank of mOTUs (i.e., species level), and their relative abundances in the profiled sample.<sample_id>.prep_long.gz: Output file of long reads that have cut up into shorter reads.
motus_<db_name>_combined_reports.txt: A combined profile of all samples aligned to a given database (as generated bymotus_merge)
Normally *_combined_reports.txt is the most useful file for downstream analyses, but the per sample .out file can provide additional more specific information. By default, nf-core/taxprofiler is providing a column describing NCBI taxonomic ID as this is used in the taxpasta step. You can disable this column by activating the argument --motus_remove_ncbi_ids.
You will receive the relative abundance instead of read counts if you provide the argument --motus_use_relative_abundance.
KMCP
KMCP utilises genome coverage information by splitting the reference genomes into chunks and stores k-mers in a modified and optimised COBS index for fast alignment-free sequence searching. KMCP combines k-mer similarity and genome coverage information to reduce the false positive rate of k-mer-based taxonomic classification and profiling methods.
Output files
-
kmcp/<db_name>/<sample_id>.gz: output ofkmcp_searchcontaining search sequences against a database in tab-delimited format with 15 columns.<sample_id>_kmcp.profile: output ofkmcp_profilecontaining the taxonomic profile from search results.
You will receive the <sample_id>.gz file if you supply --kmcp_save_search. Please note that there is no taxonomic label assignment in this output file.
The main taxonomic classification file from KMCP is the *kmcp.profile which is also used by the taxpasta step.
ganon
ganon is designed to index large sets of genomic reference sequences and to classify reads against them efficiently. The tool uses Interleaved Bloom Filters as indices based on k-mers/minimizers. It was mainly developed, but not limited, to the metagenomics classification problem: quickly assign sequence fragments to their closest reference among thousands of references. After classification, taxonomic abundance is estimated and reported.
Output files
ganon/-
<db_name>/<sample_id>_report.tre: output ofganon reportcontaining taxonomic classifications with possible formatting and/or filtering depending on options specified.<sample_id>.tre: output ofganon classifycontaining raw taxonomic classifications and abundance estimations with no additional formatting or filtering.<sample_id>.rep: ‘raw’ report of counts against each taxon.<sample_id>.all: per-read summary of all hits of each read. Only generated if--ganon_save_readclassificationsspecified.<sample_id>.one: per-read summary of the best single hit after the selection by the user specified multiple match method for each read. Only generated if--ganon_save_readclassificationsspecified.<sample_id>.unc: list of read IDs with no hits. Only generated if--ganon_save_readclassificationsspecified.<sample_id>.log: the stdout console messages printed byganon classify, containing some classification summary information
-
ganon_<db_name>_combined_reports.txt: A combined profile of all samples aligned to a given database (as generated byganon table)
-
Generally you will want to refer to the combined_reports.txt or _report.tre file. For further descriptions of the contents of each file, see the ganon documentation.
You will only receive the .all, .lca, and .unc files if you supply the --ganon_save_readclassifications parameter to the pipeline.
sylph
sylph is a program that performs metagenomic profiling or containment average nucleotide identity (ANI) querying for metagenomic shotgun sequencing samples.
Output files
sylph/<db_name>/<sample_id>.sylph.tsv: output ofsylph profilecontaining taxonomic classifications where each row is one genome detected in the sample. This output does not have any information about the species, genus, order etc<sample_id>.sylphmpa: output ofsylph-tax taxprofcontaining a taxonomic profile like Kraken or MetaPhlan.
sylph_<db_name>_combined_reports: output ofsylph-tax mergecontaining merged multiple taxonomic profiles into a TSV table.
For further descriptions of the contents of each file, see the sylph documentation.
Melon
melon is a taxonomic classifier that uses ribosomal marker genes to classify and quantify long-read metagenomic data.
Output files
melon/<db_name>/<sample_id>.tsv: taxonomic profile in TSV format<sample_id>.json: json file containing per-read taxonomic classification results
The main taxonomic classification files from melon are the *.tsv and *.json files.
For further descriptions of the contents of each file, see the melon documentation.
MetaCache
MetaCache is a taxonomic classifier that uses minhashing for the classification of reads
Output files
metacache/<db_name>/<sample_id>.abundances.txt: Absolute and relative abundance of each taxon on each rank in .txt format<sample_id>.mapping.txt: Mapping output in .txt format
MetaCache’s default read mapping output format is:
read_header | rank:taxon_name
For further description see MetaCache documentation.
Krona
Krona allows the exploration of (metagenomic) hierarchical data with interactive zooming, multi-layered pie charts.
Krona charts will be generated by the pipeline for supported tools (Kraken2, Centrifuge, Kaiju, and MALT)
Output files
krona/<tool_name>_<db_name>.html: per-tool/per-database interactive HTML file containing hierarchical piecharts
The resulting HTML files can be loaded into your web browser for exploration. Each file will have a dropdown to allow you to switch between each sample aligned against the given database of the tool.
TAXPASTA
TAXPASTA standardises and optionally merges two or more taxonomic profiles across samples into one single table. It supports multiple different classifiers simplifying comparison of taxonomic classification results between tools and databases.
Output files
-
taxpasta/<tool>_<database>*.{tsv,csv,arrow,parquet,biom}: Standardised taxon table containing multiple samples. The standard format is thetsv.- The first column describes the taxonomy ID and the rest of the columns describe the read counts for each sample.
- Note that the file naming scheme will apply regardless of whether
TAXPASTA_MERGE(multiple sample run) orTAXPASTA_STANDARDISE(single sample run) are executed. - If you have also run Bracken, the initial Kraken report (i.e., before read re-assignment) will also be included in this directory with
-brackensuffixed to your Bracken database name. For example:kraken2-<mydatabase>-bracken.tsv. However in most cases you want to use the actual Bracken file (i.e.,bracken_<mydatabase>.tsv).
By providing the path to a directory containing taxdump files to --taxpasta_taxonomy_dir, the taxon name, the taxon rank, the taxon’s entire lineage including taxon names and/or the taxon’s entire lineage including taxon identifiers can also be added in the output in addition to just the taxon ID. Addition of this extra information can be turned by using the parameters --taxpasta_add_name, --taxpasta_add_rank, --taxpasta_add_lineage and --taxpasta_add_idlineage respectively.
These files will likely be the most useful files for the comparison of differences in classification between different tools or building consensuses, with the caveat they have slightly less information than the actual output from each tool (which may have non-standard information e.g. taxonomic rank, percentage of hits, abundance estimations).
The following report files are used for the taxpasta step:
- Bracken:
<sample>_<db_name>.tsvTaxpasta used thenew_est_readscolumn for the standardised profile. - Centrifuge:
<sample_id>.centrifuge.txtTaxpasta uses thedirect_assigned_readscolumn for the standardised profile. - Diamond:
<sample_id>Taxpasta summarises number of reads per NCBI taxonomy ID standardised profile. - Kaiju:
<sample_id>_<db_name>.kaijutable.txtTaxpasta uses thereadscolumn from kaiju2table standardised profile. - KrakenUniq:
<sample_id>_<db_name>.report.txtTaxpasta uses thereadscolumn for the standardised profile. - Kraken2:
<sample_id>_<db_name>.report.txtTaxpasta uses thedirect_assigned_readscolumn for the standardised profile. - MALT:
<sample_id>.txt.gzTaxpasta uses thecount(second) column from the output of MEGAN6’s rma2info for the standardised profile. - MetaPhlAn:
<sample_id>_profile.txtTaxpasta uses therelative_abundancecolumn multiplied with a fixed number to yield an integer for the standardised profile. - mOTUs:
<sample_id>.outTaxpasta uses theread_countcolumn for the standardised profile. - ganon:
<sample_id>_<db_name>.treTaxpasta uses thenr_uniquecolumn for the standardised profile. - kmcp:
<sample_id>.profileTaxpasta uses thereadscolumn for the standardised profile.
Neither the sylph, MetaCache, nor melon classifiers are yet supported in taxpasta.
Please aware the outputs of each tool’s standardised profile may not be directly comparable between each tool. Some may report raw read counts, whereas others may report abundance information. Please always refer to the list above, for which information is used for each tool.
MultiQC
Output files
multiqc/multiqc_report.html: a standalone HTML file that can be viewed in your web browser.multiqc_data/: directory containing parsed statistics from the different tools used in the pipeline.multiqc_plots/: directory containing static images from the report in various formats.
MultiQC is a visualization tool that generates a single HTML report summarising all samples in your project. Most of the pipeline QC results are visualised in the report and further statistics are available in the report data directory.
Results generated by MultiQC collate pipeline QC from supported tools e.g. FastQC. The pipeline has special steps which also allow the software versions to be reported in the MultiQC output for future traceability. For more information about how to use MultiQC reports, see http://multiqc.info.
All tools in taxprofiler supported by MultiQC will have a dedicated section showing summary statistics of each tool based on information stored in log files.
You can expect in the MultiQC reports either sections and/or general stats columns for the following tools:
- fastqc
- adapterremoval
- fastp
- nonpareil
- bbduk
- prinseqplusplus
- nanoq
- porechop_abi
- porechop
- filtlong
- bowtie2
- minimap2
- samtools (stats)
- kraken
- bracken
- centrifuge
- kaiju
- diamond
- malt
- motus
- metaphlan
The ‘General Stats’ table by default will only show statistics referring to pre-processing steps, and will not display possible values from each classifier/profiler, unless turned on by the user within the ‘Configure Columns’ menu or via a custom MultiQC config file (--multiqc_config).
For example, DIAMOND output does not have a dedicated section in the MultiQC HTML, only in the general stats table. To turn this on, copy the nf-core/taxprofiler MultiQC config and change the DIAMOND entry in table_columns_visible: to True.
Pipeline information
Output files
pipeline_info/- Reports generated by Nextflow:
execution_report.html,execution_timeline.html,execution_trace.txtandpipeline_dag.dot/pipeline_dag.svg. - Reports generated by the pipeline:
pipeline_report.html,pipeline_report.txtandsoftware_versions.yml. Thepipeline_report*files will only be present if the--email/--email_on_failparameter’s are used when running the pipeline. - Reformatted samplesheet files used as input to the pipeline:
samplesheet.valid.csv. - Parameters used by the pipeline run:
params.json.
- Reports generated by Nextflow:
Nextflow provides excellent functionality for generating various reports relevant to the running and execution of the pipeline. This will allow you to troubleshoot errors with the running of the pipeline, and also provide you with other information such as launch commands, run times and resource usage.