nf-core/vipr
Assembly and intrahost / low-frequency variant calling for viral samples
22.10.6.
Learn more.
nf-core/vipr
This document describes the output produced by the pipeline. Results
will appear in the directory specified with the --outdir parameter
(default: results). Each sample has its own subdirectory. The
structure of a sample subdirectory is described in the following.
Read Data
Reads are preprocessed, i.e. quality trimmed (and combined in case of
multiple read pairs) as well as decontaminated. All respective data is
stored in the reads/ sub-directory
reads/{sample}_R[12]-trimmed.fastq.gz: quality trimmed (and combined) readsreads/{sample}_trimmed_decont_[12].fastq.gz: decontaminated trimmed readsreads/{sample}_trimmed_decont_[12]_fastqc.*: fastqc data for the above
Assembly
Preprocessed reads are assembled into contig and then orientated and glued together using the user-specified reference. As a final step the assembly is polished through iterative mapping, consensus calling and variant integration
{sample}_contigs.fa: Tadpole contigs{sample}-gap-filled-assembly.fa: Orientated contigs, gaps filled with reference{sample}-gap-filled-assembly.gaps.bed: reference gap positions{sample}_polished_assembly.fa: Assembly polished through iterative mapping, consensus calling and variant integration{sample}_0cov2N.fa: submission-ready reference with zero coverage positions masked
Mapping and variant calling
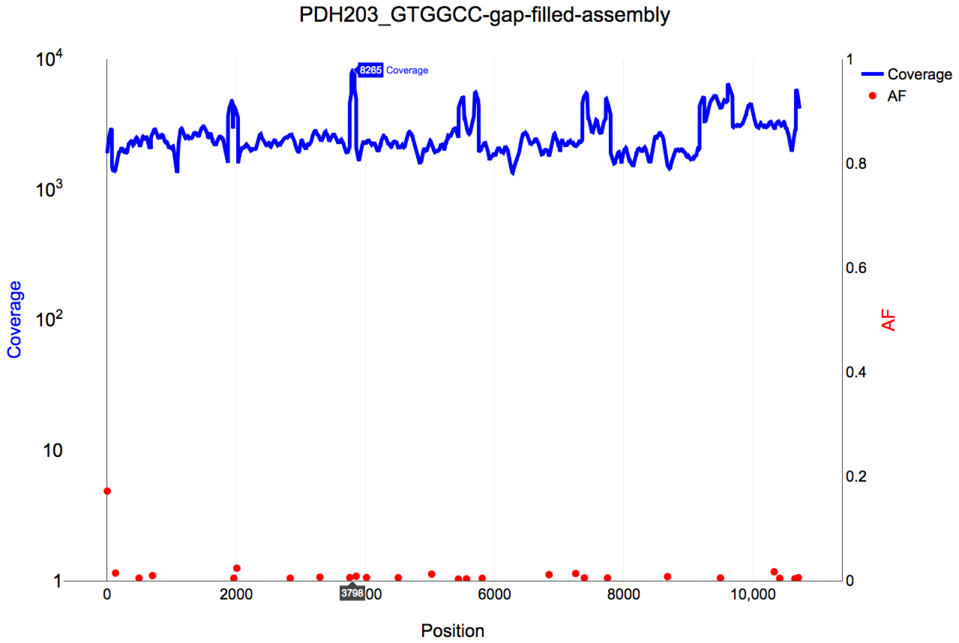
{sample}_kraken.report.txt: Kraken report{sample}.cov.gz: Coverage per position{sample}.bam: Preprocessed reads mapped against polished assembly{sample}.bam.bai: BAM index{sample}.bam.stats: Stats for BAM file{sample}.vcf.gz: LoFreq variant calls for BAM file{sample}_af-vs-cov.html: Interactive plot of variant AF vs coverage
A screenshot of the interative plot follows: