nf-core/hlatyping
Precision HLA typing from next-generation sequencing data
1.1.5). The latest stable release is2.2.0.Output
This document describes the output produced by the pipeline.
Pipeline overview
The pipeline is built using Nextflow and processes data using the following steps:
- OptiType - HLA genotyping based on integer linear programming
OptiType
OptiType is an HLA genotyping algorithm based on linear integer programming. It provides accurate 4-digit HLA genotyping predictions from NGS data. For further reading and documentation see the OptiType documentation.
The pipeline results contain a CSV file with the predicted HLA genotype. Each line contains one solution with the predicted HLA alleles in 4-digit nomenclature, the number of reads that are covered by this solution and the objective function value. If the number of enumerations (–enumerate N) is higher than 1, the CSV file will contain the optimal and sub-optimal solutions.
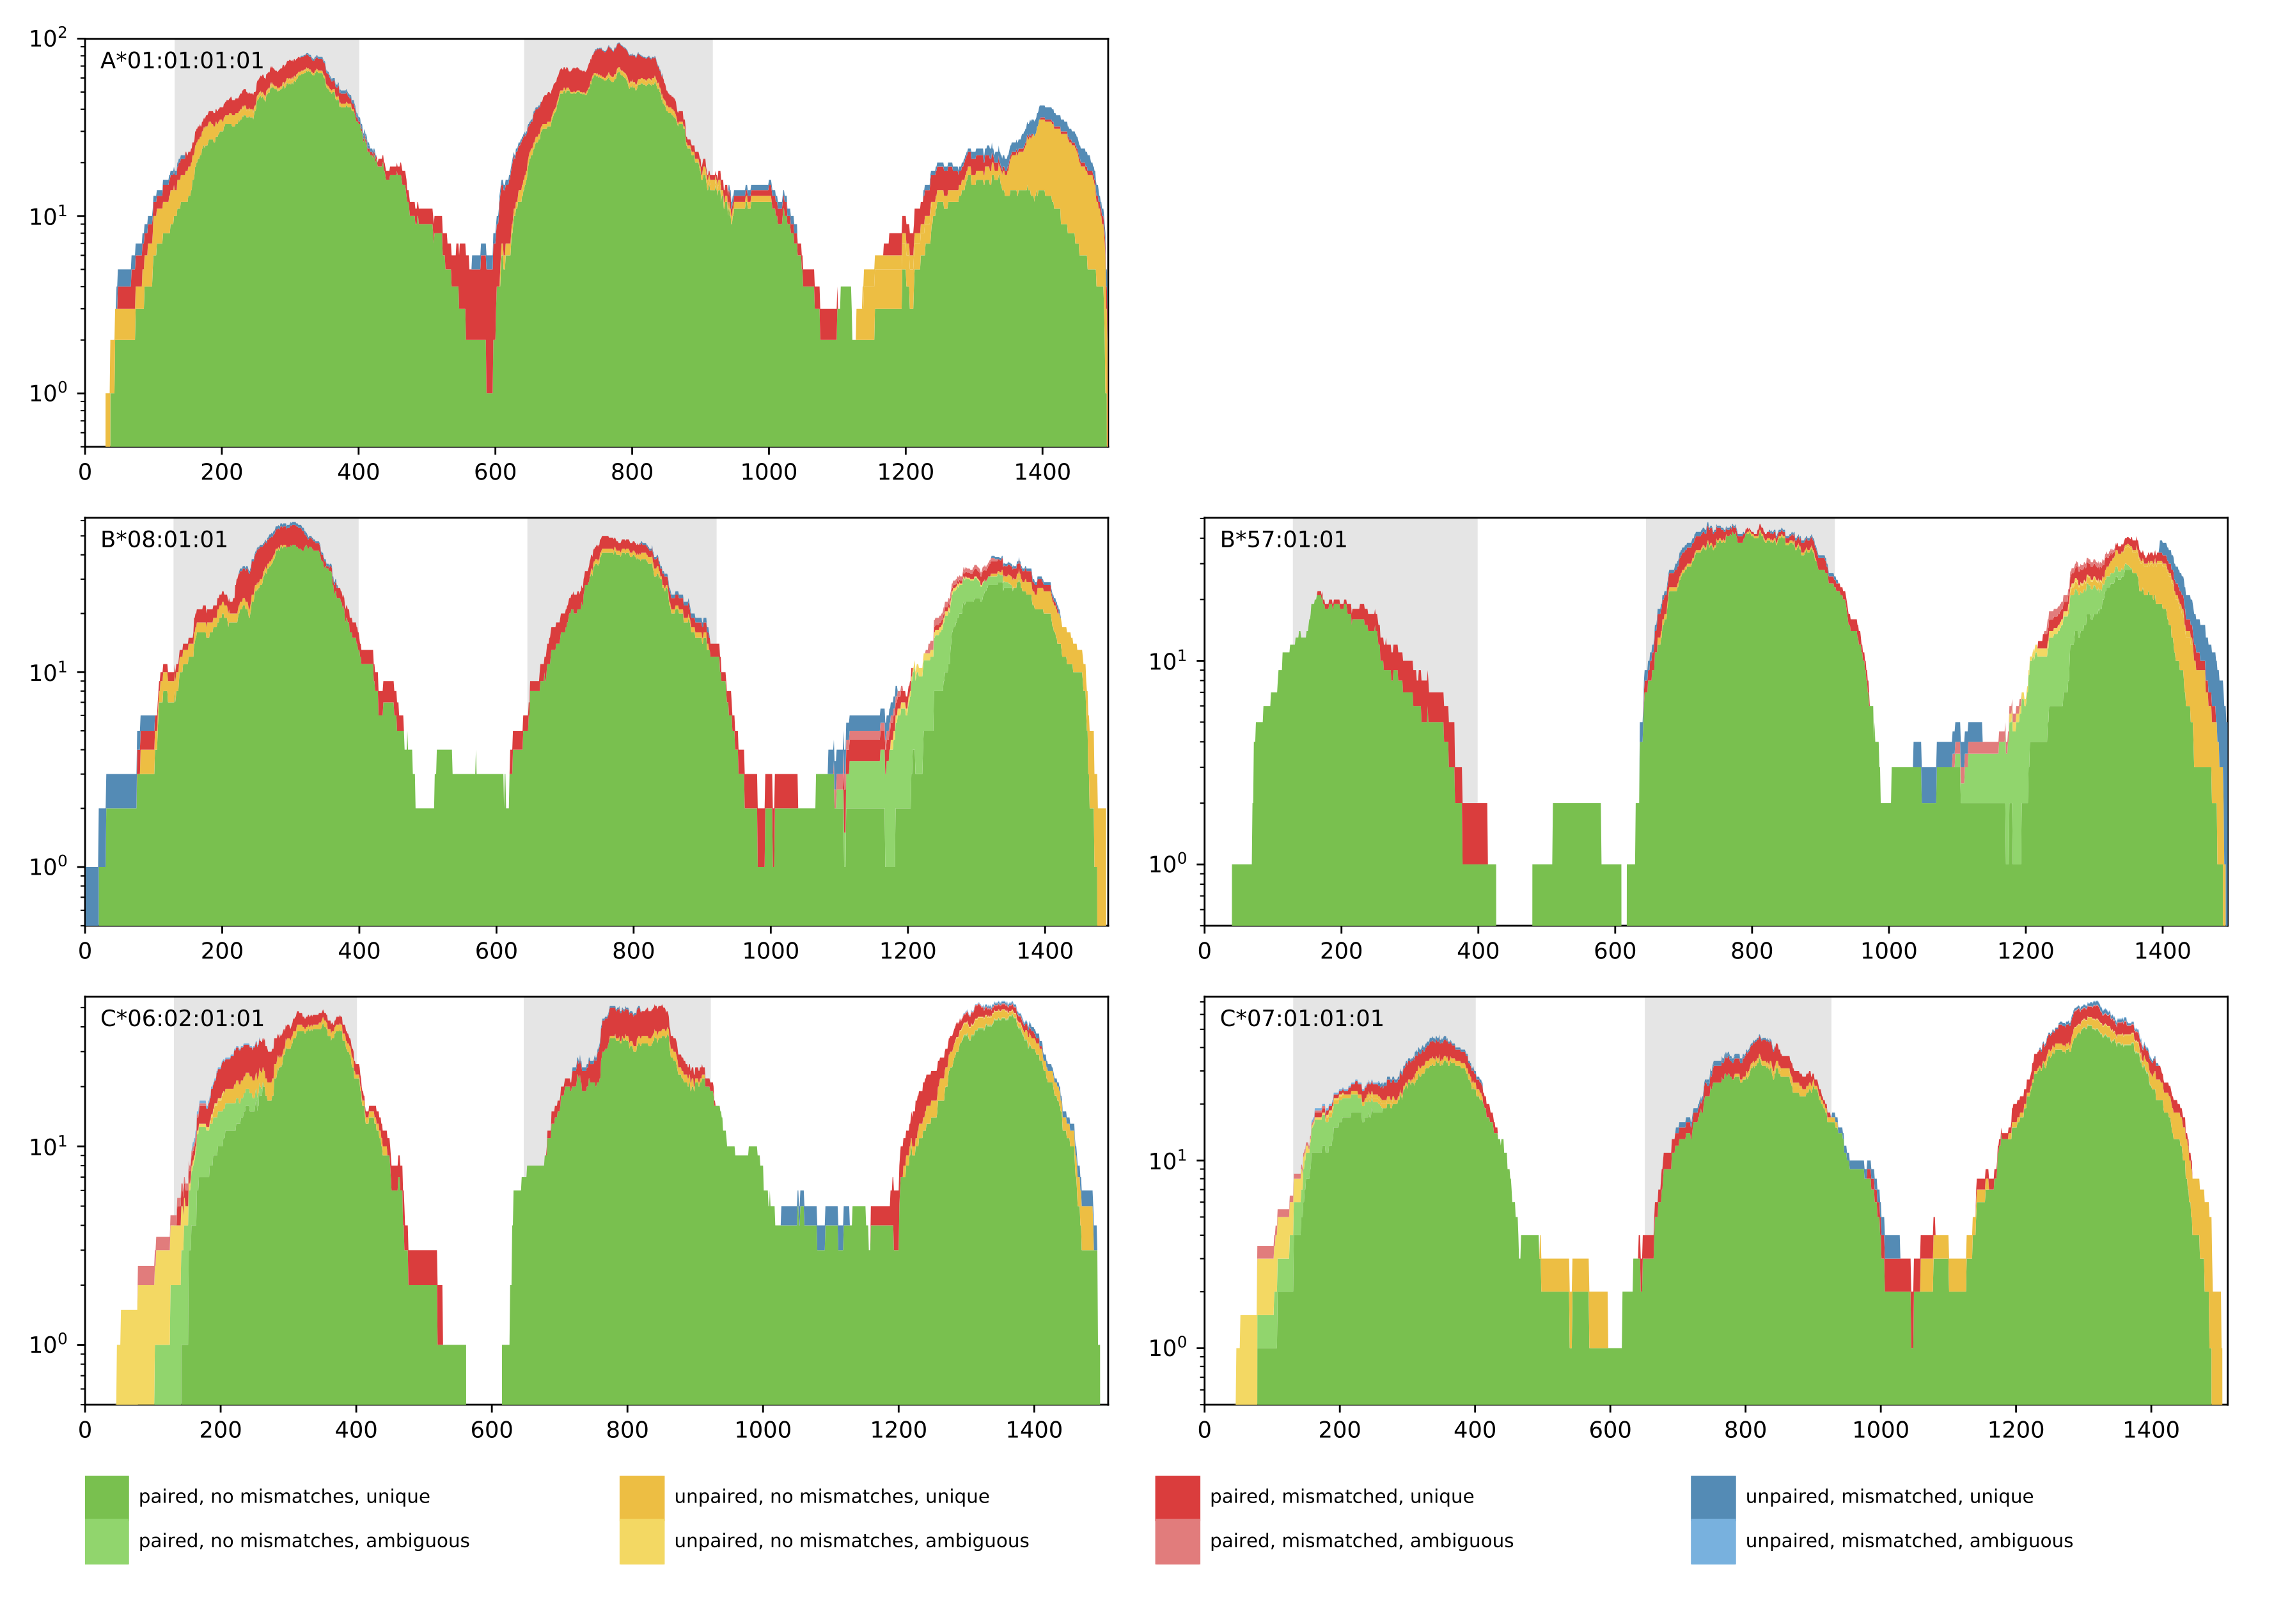
A1 A2 B1 B2 C1 C2 Reads Objective0 A*01:01 A*01:01 B*08:01 B*57:01 C*07:01 C*06:02 1127.0 1106.7139999999997Additionally, a coverage plot of the predicted HLA genotype is produced for quality control purposes (see below). The coverage plot shows the amount of reads that cover every position of the selected HLA allele sequence. Further, the color encoding denotes if reads are paired or unpaired, contain mismatches, and if the matches are unique or ambiguous. In case of homozygous solutions, the coverage plot of the corresponding HLA allele will be shown once.
Output directory: results/{timestamp}
{prefix}_{timestamp}_result.tsv- TSV file, containing the predicted optimal (anf if enumerated, sub-optimal) HLA genotype
{prefix}_{timestamp}_coverage_plot.pdf- pdf file, containing a coverage plot of the predicted alleles
MultiQC
MultiQC is a visualisation tool that generates a single HTML report summarising all samples in your project. Most of the pipeline QC results are visualised in the report and further statistics are available in within the report data directory.
The pipeline has special steps which allow the software versions used to be reported in the MultiQC output for future traceability.
Output directory: results/multiqc
Project_multiqc_report.html- MultiQC report - a standalone HTML file that can be viewed in your web browser
Project_multiqc_data/- Directory containing parsed statistics from the different tools used in the pipeline
For more information about how to use MultiQC reports, see http://multiqc.info