nf-core/pairgenomealign
Pairwise genome comparison pipeline using the LAST software to align a list of query genomes to a target genome, and plot the results
Introduction
This document describes the output produced by the pipeline.
The directories listed below will be created in the results directory after the pipeline has finished. All paths are relative to the top-level results directory.
Pipeline overview
The pipeline is built using Nextflow and processes data using the following steps:
- Alignments - Alignment of the query genomes to the target genome
- Dot plots - Visualisation of the alignment of the query genomes to the target genome
Nregions - Coordinate of theNregions on the query and target genomes- MultiQC - Aggregate report describing results and QC from the whole pipeline
- Pipeline information - Report metrics generated during the workflow execution
Each query genome, is aligned to the target genome, and each alignment is visualised with dot plots. The output file names are constructed by concatenating the target and query sample identifiers with a ___ separator (three underscores), to faciliate re-extraction of the IDs from file names.
Assembly statistics
Output files
assemblyscan/*.jsoncontains the statistics collected with theassembly-scansoftware.
Basic statistics on nucleotide content and contig length are collected for aligned genome for later plotting with MultiQC.
Alignments
Output files
alignment/*.trainis the alignment parameters computed bylast-train(optional)*.train.tsvreports some of the parameters computed bylast-trainfor MultiQC (optional)*.m2m_aln.maf.gzis the many-to-many alignment between target and query genomes. (optional through the--m2moption)*.m2o_aln.maf.gzis the many-to-one alignment regions of the target genome are matched at most once by the query genome. (optional through the--m2moption)*.o2m_aln.maf.gzis the one-to-many alignment between the target and query genomes. (optional through the--m2moption)*.o2o_aln.maf.gzis the one-to-one alignment between the target and query genomes.*.o2o_aln.tsvreports nucleotide percent identity of the one-to-one alignment for MultiQC.- For each one-to-one alignment there will be an additional file in a format such as Axt, Chain, GFF or SAM/BAM/CRAM if you used the
--export_aln_toparameter. These extra files are always compressed with gzip when their format is text-based. The SAM/BAM/CRAM files are always sorted. Their header features all sequences from the target genome, including the ones that did not align to the query so that alignment files can be merged without disturbing the sort order.
Genomes are aligned witn lastal after alignment parameters have been determined with last-train. Many-to-many alignments are progressively converted to one-to-one with last-split.
Dot plots
Output files
alignment/*.m2m_plot(optional)*.m2o_plot(optional)*.o2o_plot(optional)*.o2m_plot(optional)
Dot plots are representing the pairwise genome alignments and produced with the last-dotplot tool. By default, their maximal width is fixed to aproximately 1000 pixels, so that the target genome is always represented at the same scale in all plots. In the one-to-one alignment example below, the hg38 human genome (target) is represented on the horizontal axis and a monkey genopme (Macaca mulatta accession number GCA\_049350105.1) on the vertical axis (query). Regions containing unknown (N) sequences are on pink background. Forward (+/+) alignments are plotted in red and reverse (+/– or –/+) in blue. Target (human) contigs are displayed in their original order. Query contigs (monkey) are reordered and possibly reverse-complemented to diagonalise the plot as much as possible. The names of reverse-complemented contigs are printed in blue.

N regions
Output files
cutn/targetGenome.bed<sample>.bed
The poly-N regions longer than 9 bases in each genome sequence often indicate contig boundaries in scaffolds. Therefore, we marked them in pale red in the dot-plots. They are detected with theseqtk cutN command and its output (in 3-column BED format) is provided in the cutn directory. Sample IDs are constructed to generate file names, except for the target genome which is always called targetGenome to avoid filename collisions.
MultiQC
Output files
multiqc/multiqc_report.html: a standalone HTML file that can be viewed in your web browser.multiqc_data/: directory containing parsed statistics from the different tools used in the pipeline./multiqc_data/multiqc_train.txt: table reporting the alignment parameters chosen bylast-train, for each sample.multiqc_data/multiqc_last_o2o.txt: table reporting the nucleotide percent identity in the alignments computed bylastal, for each sample.
multiqc_plots/: directory containing static images from the report in various formats.assemblyscan_plot_data: GC content and contig length statistics parsed fromassemblyscanfor MultiQC with a local module.
MultiQC is a visualization tool that generates a single HTML report summarising all samples in your project. Most of the pipeline QC results are visualised in the report and further statistics are available in the report data directory.
Results generated by MultiQC collate pipeline QC from supported tools e.g. FastQC. The pipeline has special steps which also allow the software versions to be reported in the MultiQC output for future traceability. For more information about how to use MultiQC reports, see http://multiqc.info.
The example MultiQC plots below were generated on this pipeline’s full test dataset, which aligns the hg38 human genome to other primate genomes.
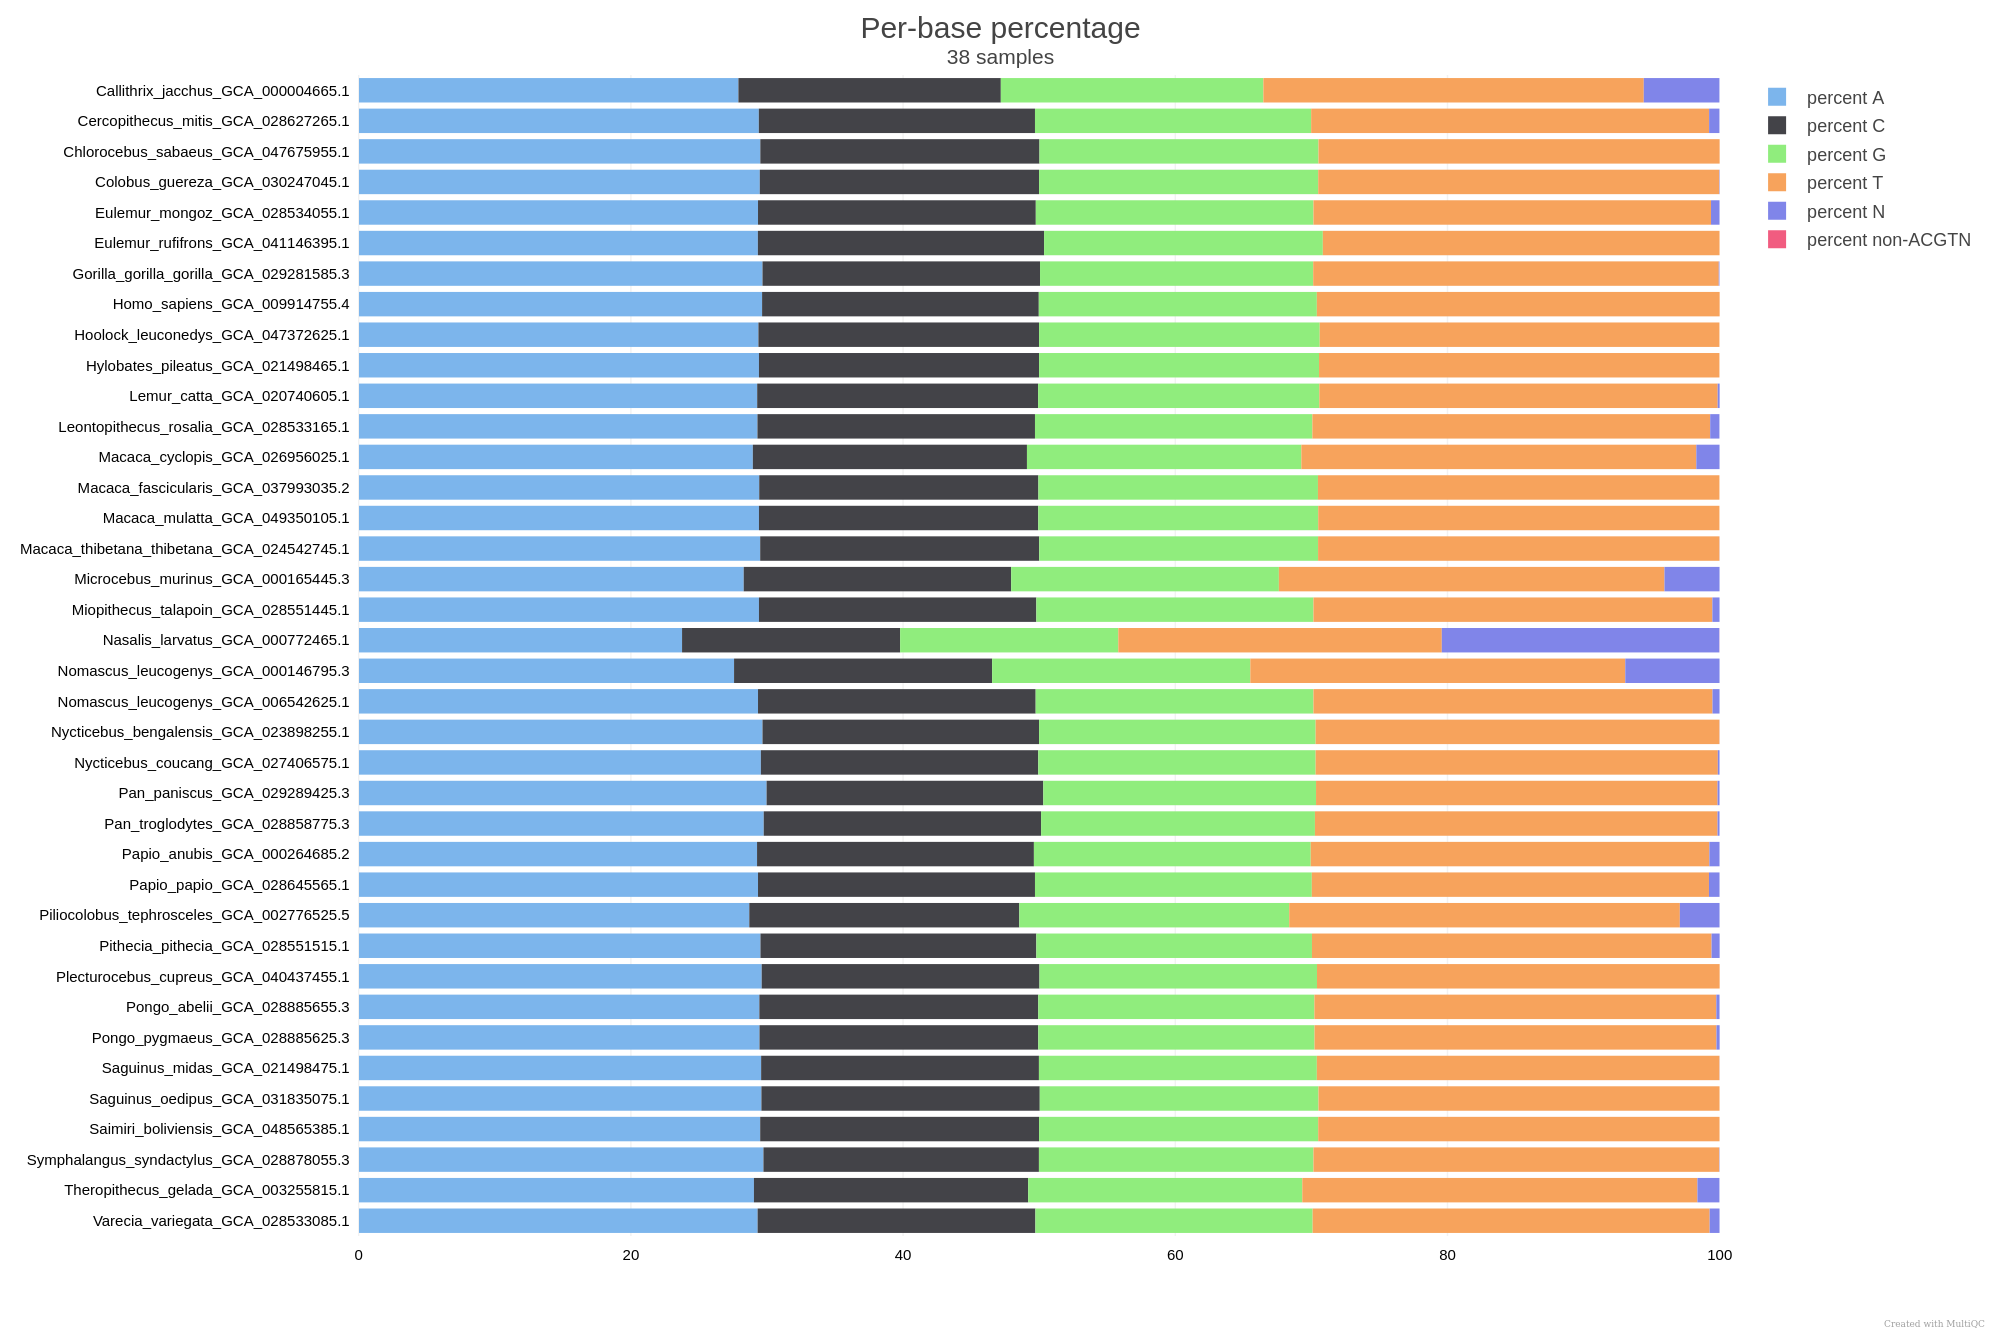
Base content
The pipeline reports the base content of every query genome, like in the example below:

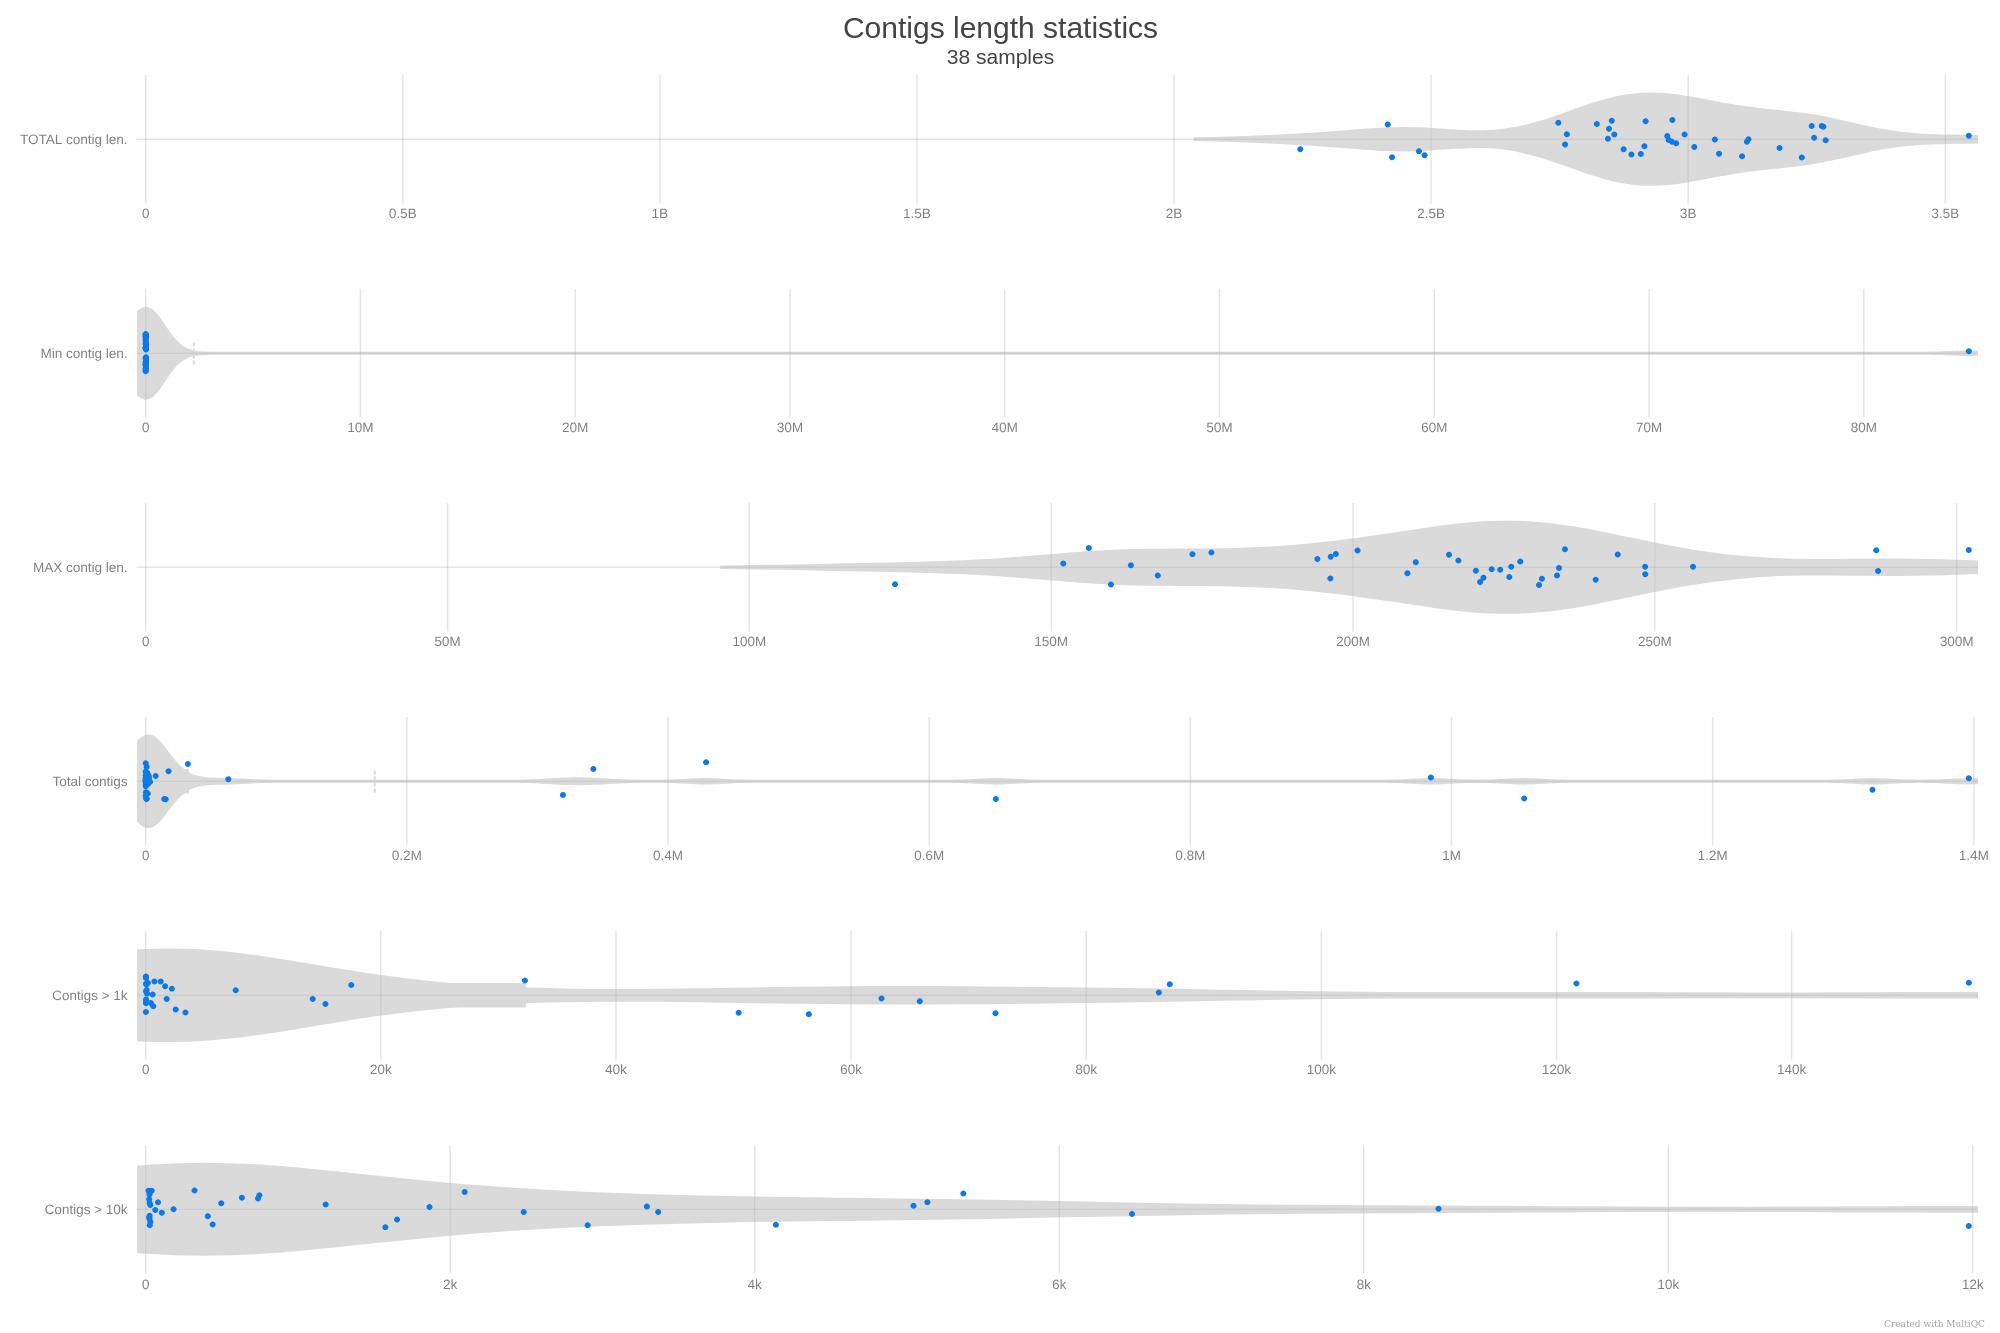
Contig length statistics
Contig length statistics can be displayed by MultiQC as violin plots.

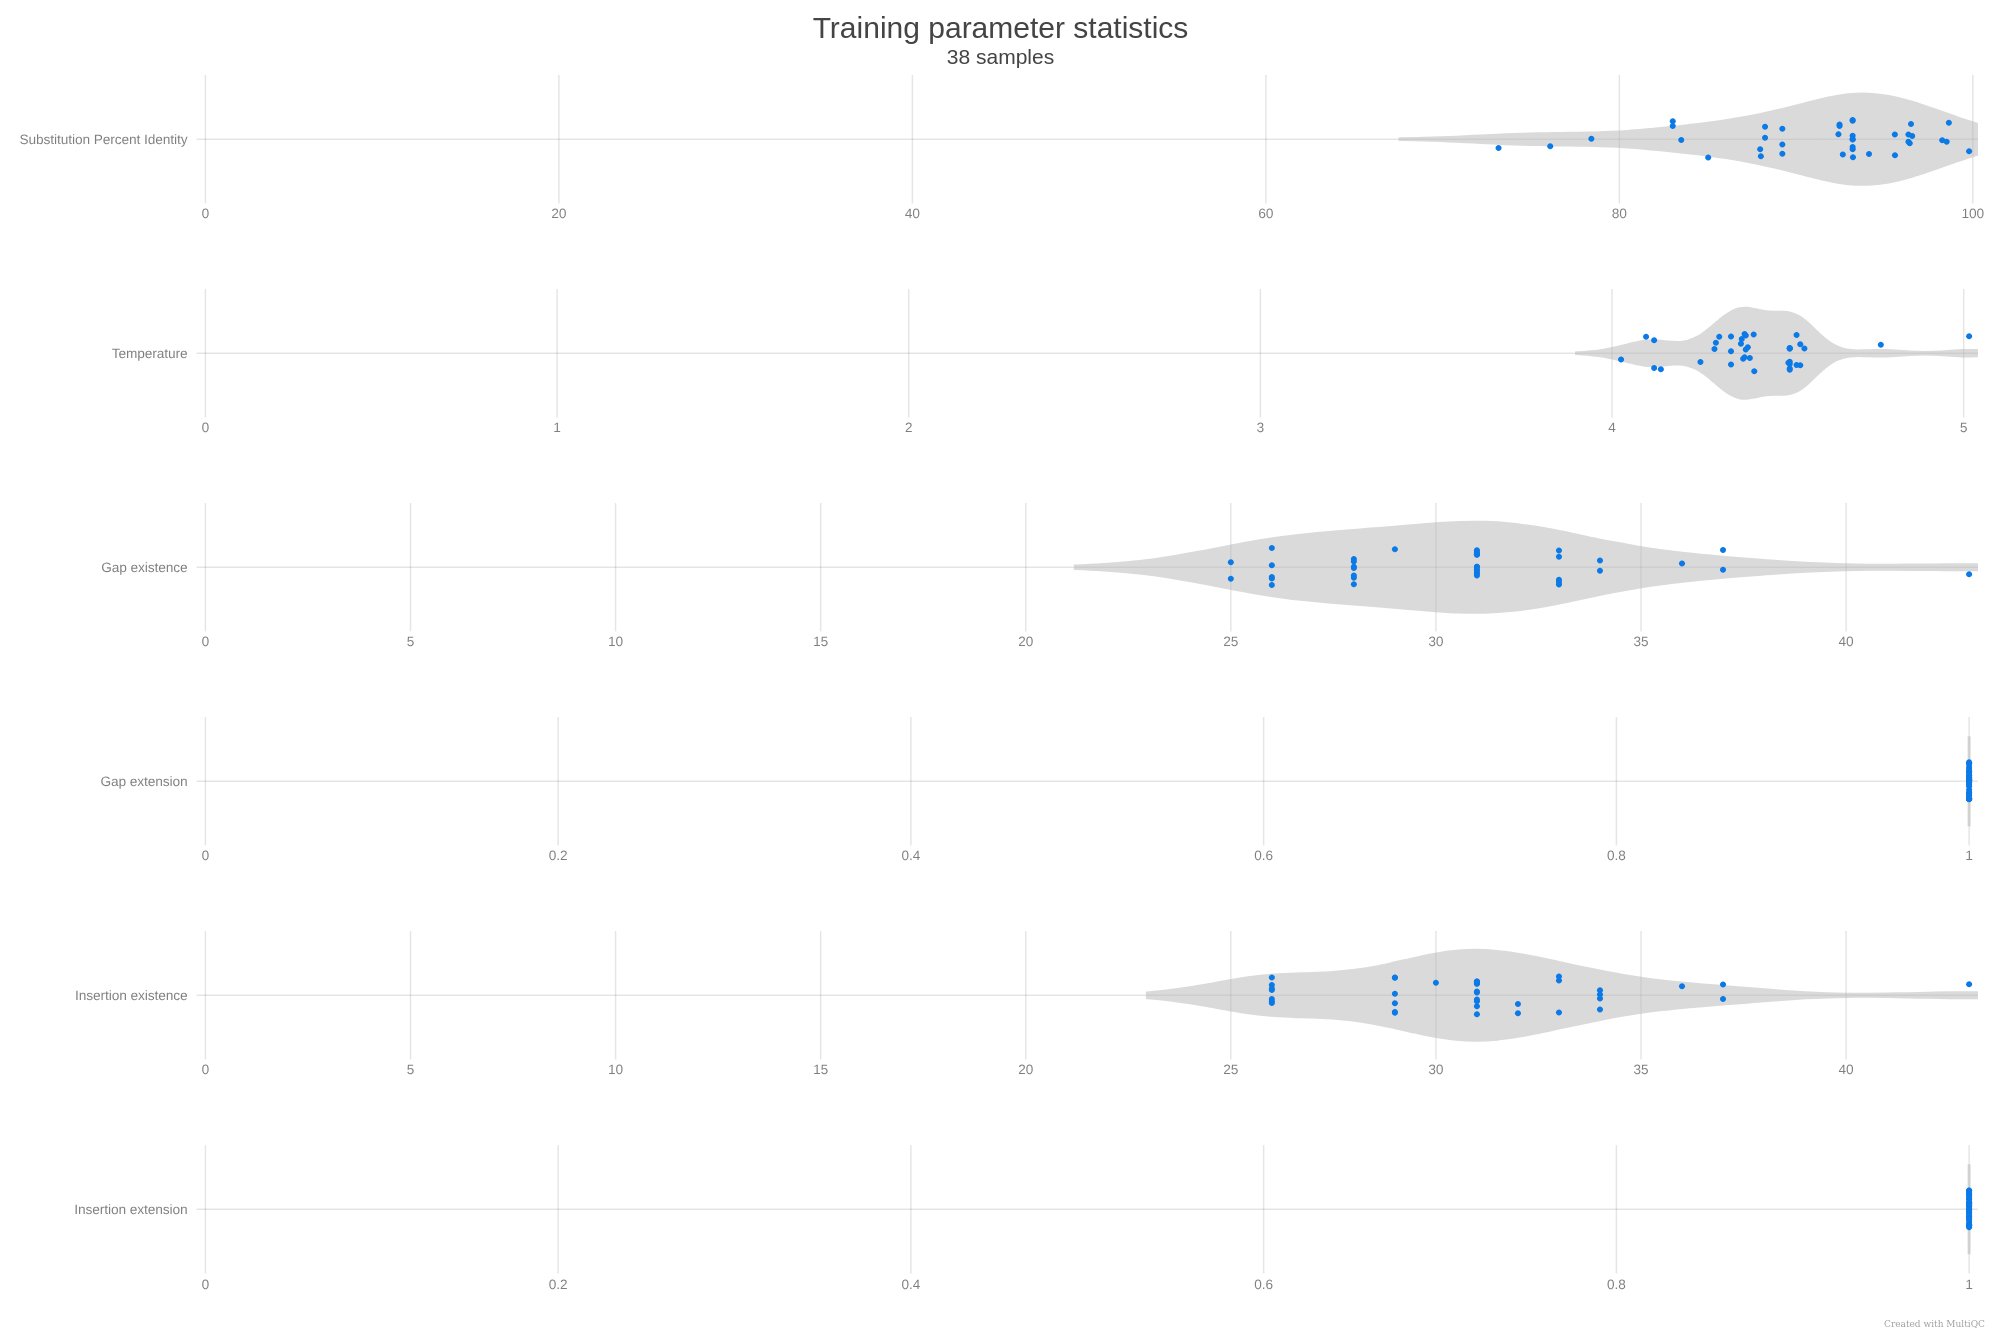
Training parameters
Alignment parameters computed by last-train can be displayed by MultiQC as violin plots.

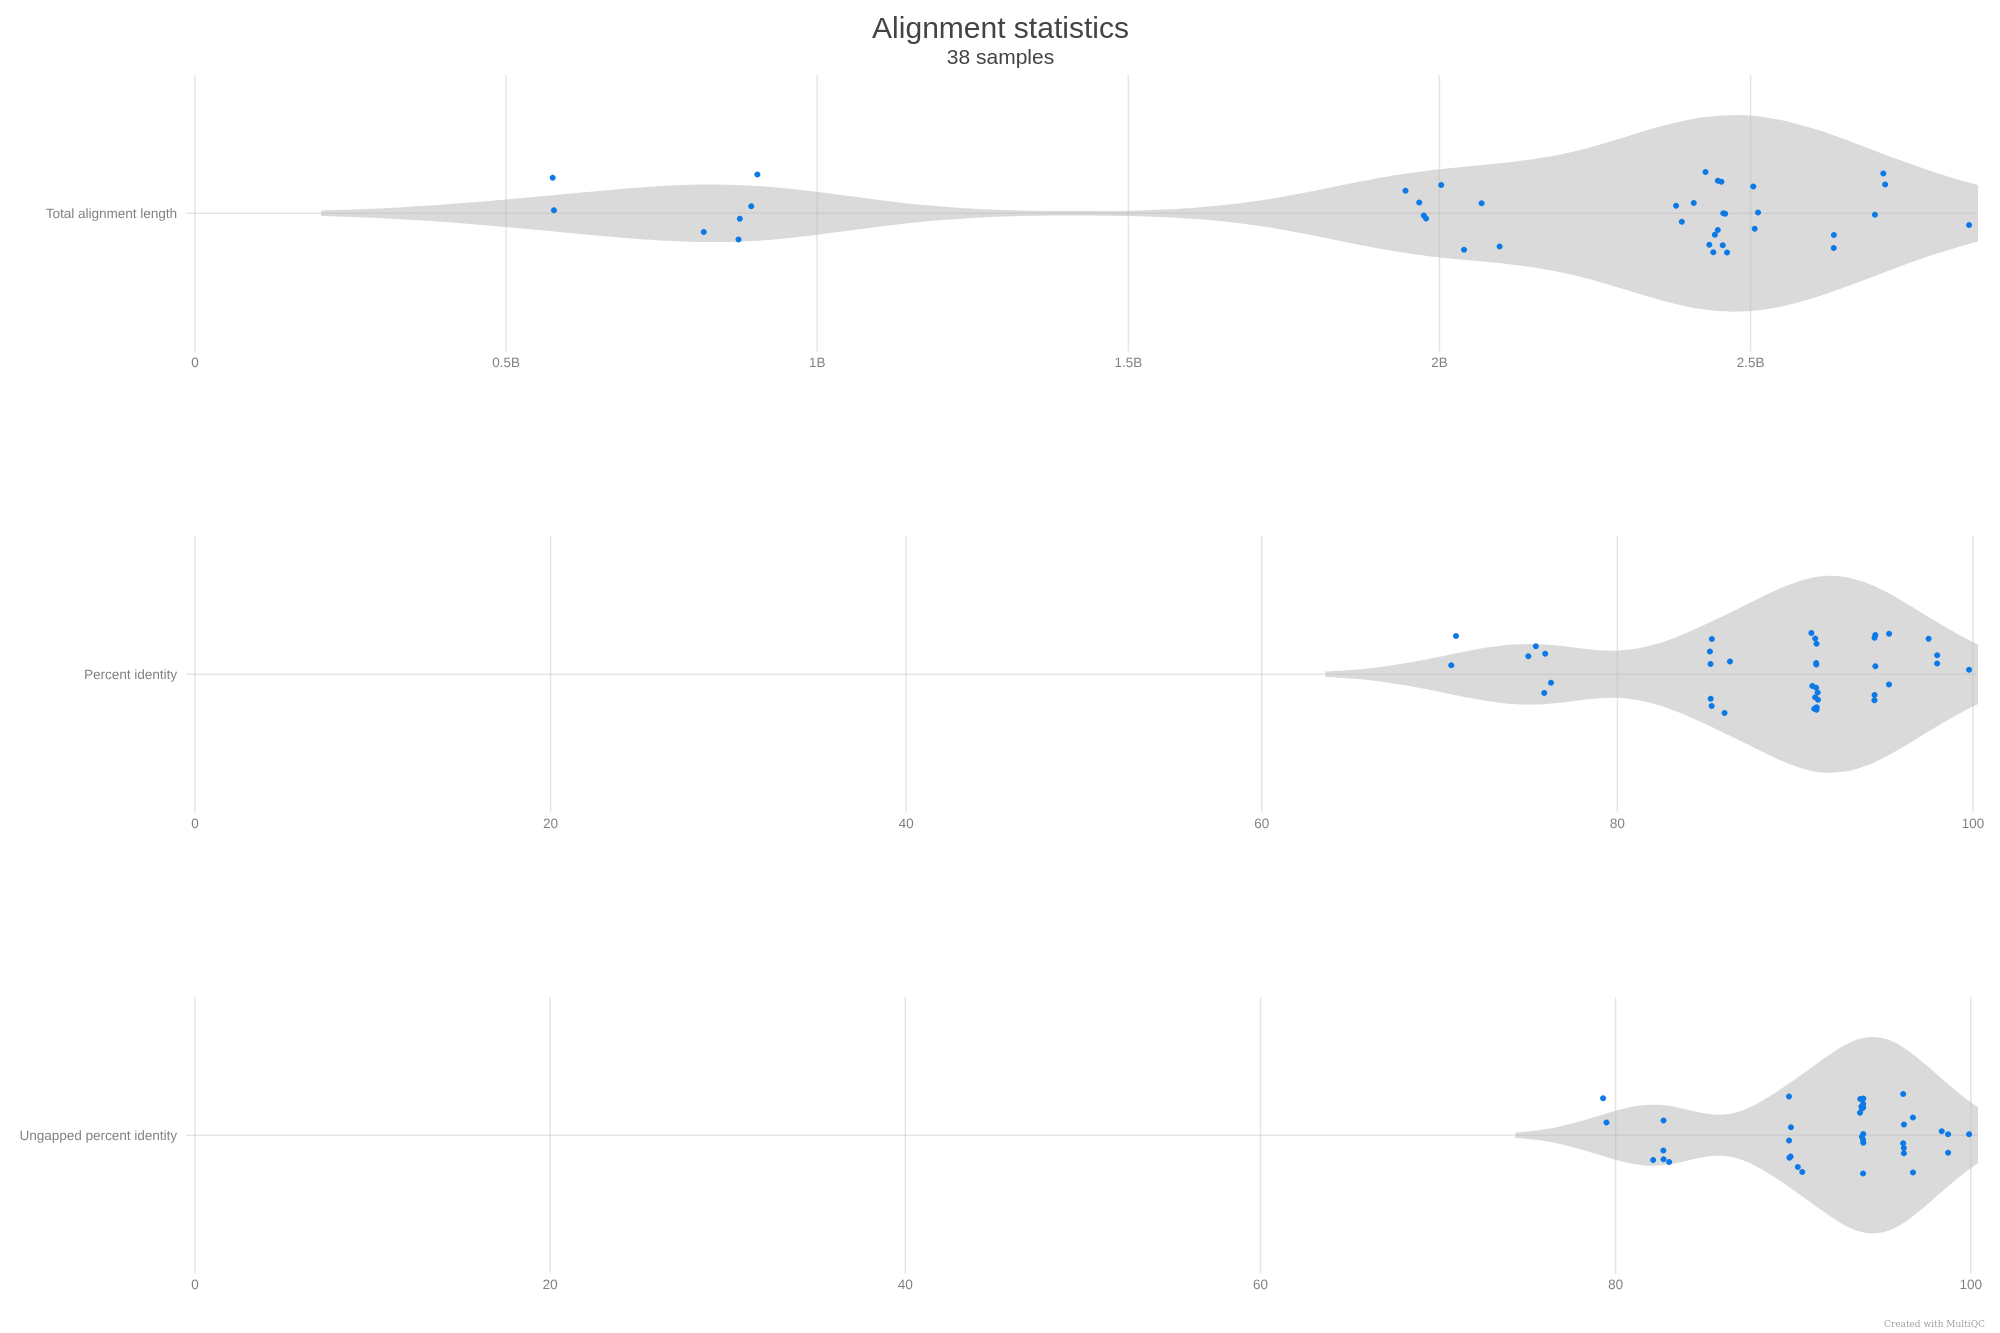
Alignment
Alignment statistics can be displayed by MultiQC as violin plots. There is no standard way to compute nucleotide identity (May A. 2004), therefore the pipeline reports two alternatives, including or excluding gaps from the computation.

Pipeline information
Output files
pipeline_info/- Reports generated by Nextflow:
execution_report.html,execution_timeline.html,execution_trace.txtandpipeline_dag.dot/pipeline_dag.svg. - Reports generated by the pipeline:
pipeline_report.html,pipeline_report.txtandsoftware_versions.yml. Thepipeline_report*files will only be present if the--email/--email_on_failparameter’s are used when running the pipeline. - Reformatted samplesheet files used as input to the pipeline:
samplesheet.valid.csv. - Parameters used by the pipeline run:
params.json.
- Reports generated by Nextflow:
Nextflow provides excellent functionality for generating various reports relevant to the running and execution of the pipeline. This will allow you to troubleshoot errors with the running of the pipeline, and also provide you with other information such as launch commands, run times and resource usage.