Introduction
This document describes the output produced by the pipeline based on a public dataset.
The directories listed below are created in the directory defined by params.outdir after the pipeline has finished.
All paths are relative to this top-level results directory.
Dataset
RNAseq data has been taken from GM12878 GIAB sample SRA Accession SRR5665260. The dataset has 38.6 million PE reads of read length 2x151 bp from NextSeq 500 sequencing platform.
Samplesheet
A sample sheet has been prepared in the following way to set the FASTQ files to run the analysis.
sample,fastq_1,fastq_2GM12878,/data/GM12878/SRR5665260_1.fastq.gz,/data/GM12878/SRR5665260_2.fastq.gzExecution
The pipeline has been executed with the following command:
nextflow run nf-core/rnavar -profile <institutional_config>,docker --input samplesheet.csv --genome GRCh38 --tools merge --outdir resultsThe <institutional_config> used in this experiment can be found here. However, you can create your own institutional config and place it on nf-core/configs and then use the config name directly in the command instead of <institutional_config> to use your own data and parameters.
Pipeline overview
The pipeline is built using Nextflow and processes data using the following steps:
- nf-core/rnavar: Output
Preprocessing
cat
Output files
fastq/*.merged.fastq.gz: If--save_merged_fastqis specified, concatenated FastQ files will be placed in this directory.
If multiple libraries/runs have been provided for the same sample in the input samplesheet (e.g. to increase sequencing depth) then these will be merged at the very beginning of the pipeline in order to have consistent sample naming throughout the pipeline. Please refer to the usage documentation to see how to specify these samples in the input samplesheet.
umitools
Output files
preprocessing/umitools/[SAMPLE]//[SAMPLE]/.umi_extract.fastq.gz: For single-end data[SAMPLE]/.umi_extract_1.fastq.gz: For paired-end data[SAMPLE]/.umi_extract_2.fastq.gz: For paired-end data
reports/umitools/[SAMPLE]/,[SAMPLE]/.umi_extract.log: The log of the UMI extraction
This output directory will only be made when --extract_umi has been specified. UMI-tools is a set of tools for handling Unique Molecular Identifiers in NGS data sets. In this pipeline the extract tool has been used to extract UMIs from the FASTQ files. Please refer to the usage documentation for more information.
Alignment
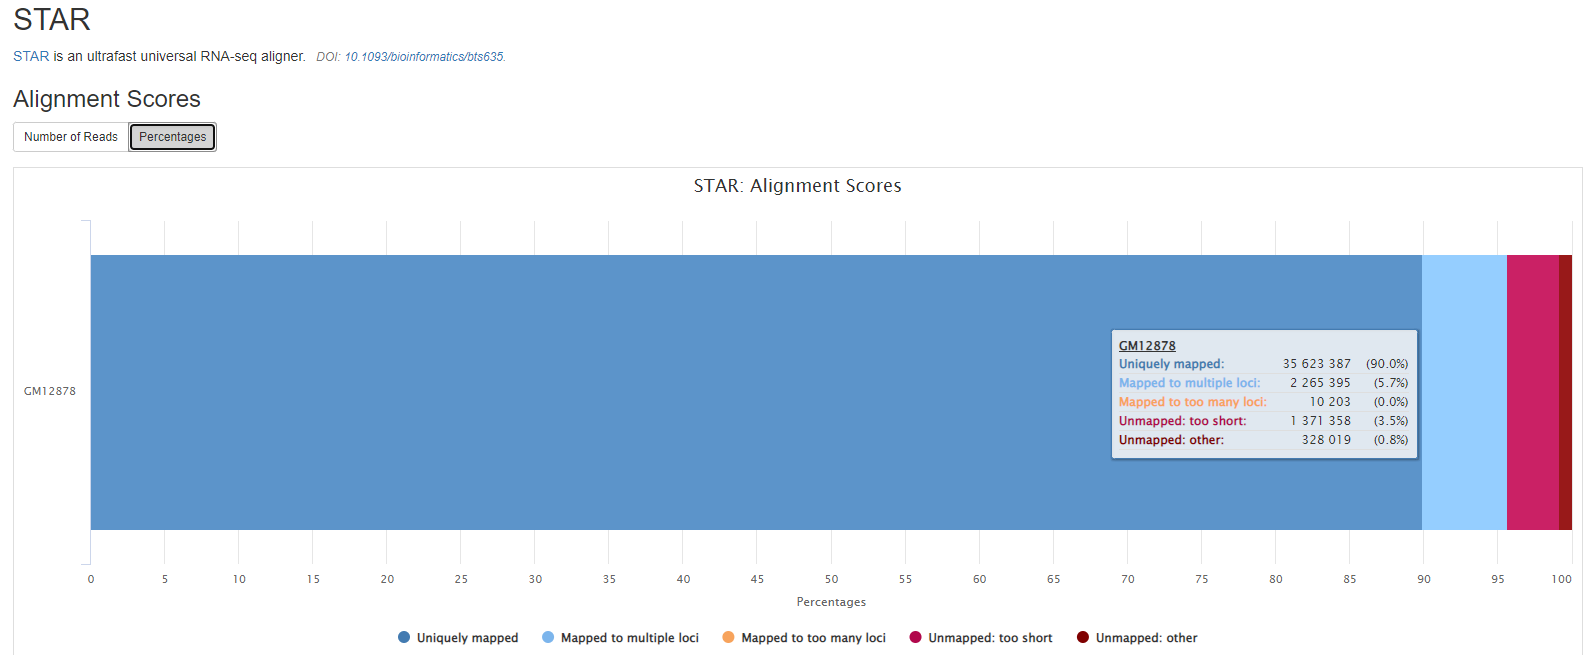
STAR
STAR is a read aligner designed for splice aware mapping typical of RNA sequencing data. STAR stands for Spliced Transcripts Alignment to a Reference, and has been shown to have high accuracy and outperforms other aligners by more than a factor of 50 in mapping speed, but it is memory intensive.
Output files
preprocessing/[SAMPLE]/[SAMPLE].aligned.bam: If--save_align_intermedsis specified the original BAM file containing read alignments to the reference genome will be placed in this directory.[SAMPLE].aligned.bam.bai: This is the index of the above[SAMPLE].aligned.bam
reports/star/[SAMPLE]/[SAMPLE].Log.final.out: STAR alignment report containing the mapping results summary.[SAMPLE].Log.outand[SAMPLE].Log.progress.out: STAR log files containing detailed information about the run. Typically only useful for debugging purposes.[SAMPLE].SJ.out.tab: File containing filtered splice junctions detected after mapping the reads.
preprocessing/[SAMPLE]/unmapped[SAMPLE].unmapped_*.fastq.gz: If--save_unalignedis specified, FastQ files containing unmapped reads will be placed in this directory.
Alignment post-processing
MarkDuplicates
Picard MarkDuplicates locates and tags duplicate reads in a BAM file. The tool’s main output is a new BAM file, in which duplicates have been identified in the SAM flags field for each read.
If desired, duplicates can be removed using the --remove_duplicates true option.
Output files
preprocessing/[SAMPLE]/[SAMPLE].md.bam: Picard Markduplicate bam file.[SAMPLE].md.bam.bai: This is the index of the above[SAMPLE].md.bam
SplitNCigarReads
GATK SplitNCigarReads is executed for post-processing RNA reads aligned against the reference. The tool’s main output is a new BAM file with reads split at N CIGAR elements and CIGAR strings updated.
Currently, the pipeline does not produce the new BAM file in the output directory.
Base (Quality Score) Recalibration
Base quality recalibration step runs by default and it produces the recalibrated BAM file for variant calling, as described below. However, you can turn off this step by using --skip_baserecalibration true option, and in that case, no recalibrated BAM file is produced and the pipeline uses the un-calibrated BAM file will be used for variant calling.
GATK BaseRecalibrator
GATK BaseRecalibrator generates a recalibration table based on various co-variates.
Currently, the pipeline does not produce the recalibration table file in the output directory.
GATK ApplyBQSR
GATK ApplyBQSR recalibrates the base qualities of the input reads based on the recalibration table produced by the GATK BaseRecalibrator tool.
Output files
preprocessing/[SAMPLE]/[SAMPLE].recal.bam: Recalibrated bam file.[SAMPLE].recal.bam.bai: This is the index of the above[SAMPLE].recal.bam
HLA typing
seq2HLA performs precision HLA typing and expression analysis from RNA-seq data. The tool uses Bowtie2 alignment to map reads to HLA reference sequences and determines HLA genotypes at both 2-digit and 4-digit resolution for both classical and non-classical HLA Class I alleles, as well as Class II alleles.
Output files
seq2hla/[SAMPLE]/[SAMPLE]-ClassI-class.HLAgenotype2digits: HLA Class I 2-digit genotype results for classical alleles[SAMPLE]-ClassI-class.HLAgenotype4digits: HLA Class I 4-digit genotype results for classical alleles[SAMPLE]-ClassI-class.expression: Expression levels of HLA Class I classical alleles[SAMPLE]-ClassI-class.bowtielog: Bowtie2 alignment log for HLA Class I classical alleles[SAMPLE]-ClassI-nonclass.HLAgenotype2digits: HLA Class I 2-digit genotype results for non-classical alleles[SAMPLE]-ClassI-nonclass.HLAgenotype4digits: HLA Class I 4-digit genotype results for non-classical alleles[SAMPLE]-ClassI-nonclass.expression: Expression levels of HLA Class I non-classical alleles[SAMPLE]-ClassI-nonclass.bowtielog: Bowtie2 alignment log for HLA Class I non-classical alleles[SAMPLE]-ClassII.HLAgenotype2digits: HLA Class II 2-digit genotype results[SAMPLE]-ClassII.HLAgenotype4digits: HLA Class II 4-digit genotype results[SAMPLE]-ClassII.expression: Expression levels of HLA Class II alleles[SAMPLE]-ClassII.bowtielog: Bowtie2 alignment log for HLA Class II alleles[SAMPLE].ambiguity: Reports typing ambiguities when more than one solution for an allele is possible (optional)
HLA typing is performed when the parameter --tools seq2hla is set. The 2-digit resolution provides broad HLA type classification, while 4-digit resolution offers more precise allele-level typing. Expression files contain quantitative information about HLA allele expression levels derived from the RNA-seq data.
Variant calling
GATK HaplotypeCaller is used to call SNVs and small indels in the sample. The Recalibrated BAM file is used as an input to this process and the output file is produced in VCF format.
Output files
variant_calling/[SAMPLE]/[SAMPLE].haplotypecaller.vcf.gz: Variant calls in VCF format.[SAMPLE].haplotypecaller.vcf.gz.tbi: This is the index of the above VCF file.
Variant filtering
GATK VariantFiltration is used for hard-filtering variant calls based on certain criteria. Records are hard-filtered by changing the value in the FILTER field to something other than PASS. Filtered records will be preserved in the output.
Output files
variant_calling/[SAMPLE]/[SAMPLE].haplotypecaller.filtered.vcf.gz: Variant VCF with updated FILTER field.[SAMPLE].haplotypecaller.filtered.vcf.gz.tbi: This is the index of the above VCF file.
Variant annotation
This directory contains results from the final annotation steps: three tools are used for annotation, BCFtools Annotate, snpEff and VEP.
snpEff
snpeff is a genetic variant annotation and effect prediction toolbox.
It annotates and predicts the effects of variants on genes (such as amino acid changes) using multiple databases for annotations.
The generated VCF header contains the software version and the used command line.
To annotate variants using snpeff, you can use --tools snpeff or --tools merge.
The annotated variant files in VCF format can be found in annotation folder.
Output files
annotation/[SAMPLE]/[SAMPLE]_snpEff.ann.vcf.gz: Annotated VCF from snpEff process.[SAMPLE]_snpEff.ann.vcf.gz.tbi: This is the index of the above VCF file.
For further reading and documentation see the snpEff manual
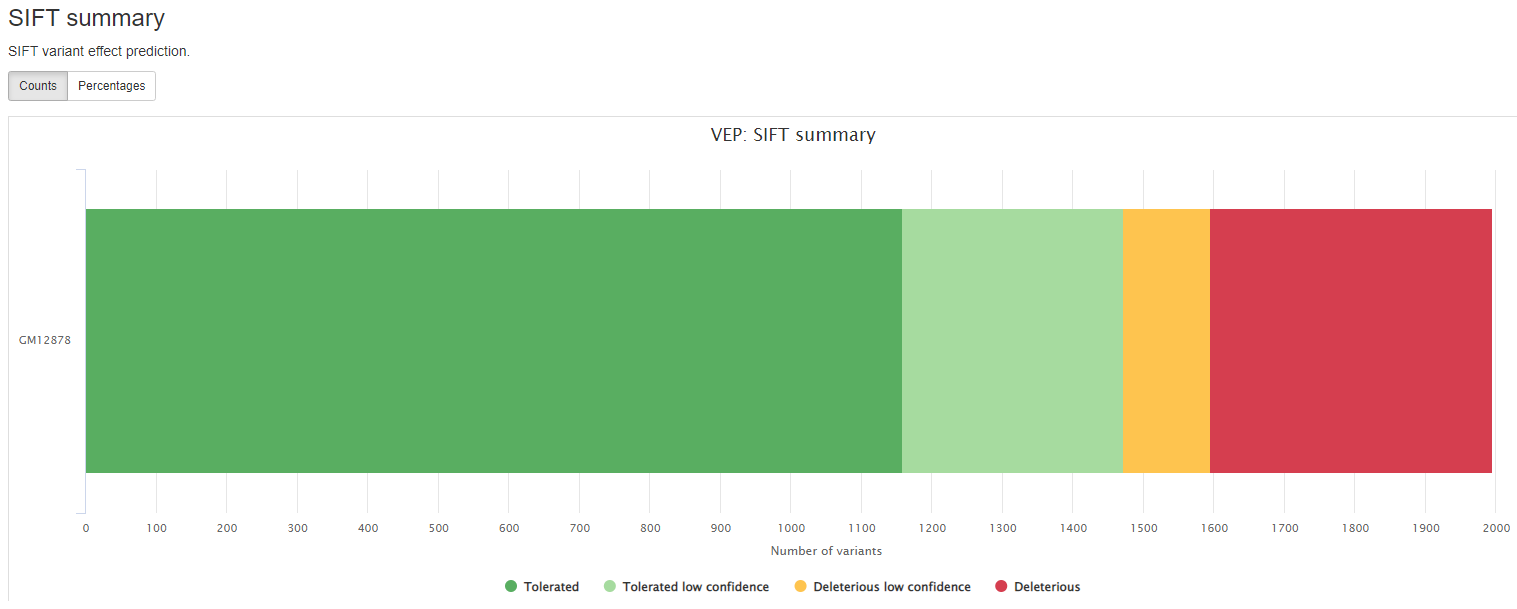
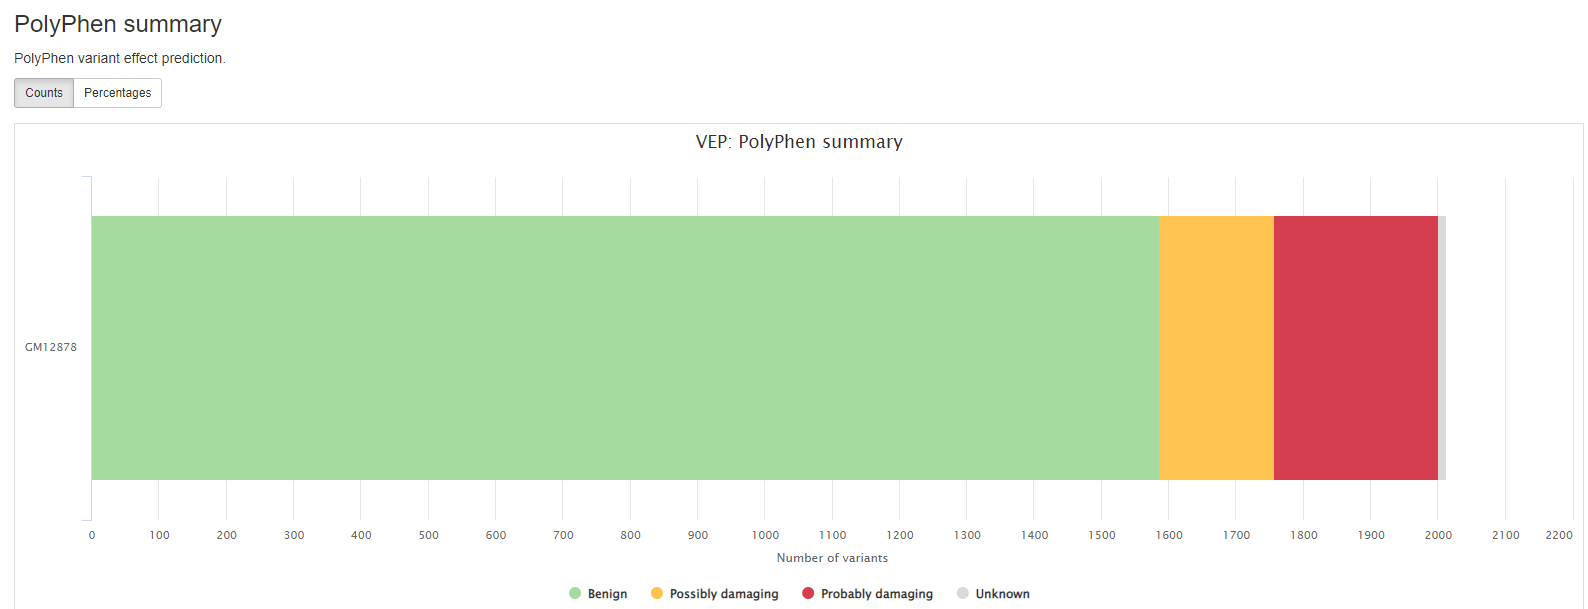
VEP
VEP (Variant Effect Predictor), based on Ensembl, is a tool to determine the effects of the variants. The generated VCF header contains the software version, also the version numbers for additional databases like Clinvar or dbSNP used in the VEP line.
The format of the consequence annotations is also in the VCF header describing the INFO field.
Currently, it contains:
Consequence: impact of the variation, if there is anyCodons: the codon change, i.e. cGt/cAtAmino_acids: change in amino acids, i.e. R/H if there is anyGene: ENSEMBL gene nameSYMBOL: gene symbolFeature: actual transcript nameEXON: affected exonPolyPhen: prediction based on PolyPhenSIFT: prediction by SIFTProtein_position: Relative position of amino acid in proteinBIOTYPE: Biotype of transcript or regulatory feature
To annotate variants using vep, you can use --tools vep.
The annotated variant files in VCF format can be found in annotation folder.
Output files
annotation/[SAMPLE]/[SAMPLE]_VEP.ann.vcf.gz: Annotated VCF from VEP process.[SAMPLE]_VEP.ann.vcf.gz.tbi: This is the index of the above VCF file.
When --tools merge option is used, the annotation from both snpeff and vep are combined into a single VCF file which can be found with the following naming convention.
Output files
annotation/[SAMPLE]/[SAMPLE]_snpEff_VEP.ann.vcf.gz: Combined annotation from both snpEff and VEP.[SAMPLE]_snpEff_VEP.ann.vcf.gz.tbi: This is the index of the above VCF file.
For further reading and documentation see the VEP manual
BCFtools annotate
BCFtools annotate is used to add annotations to VCF files. The annotations are added to the INFO column of the VCF file. The annotations are added to the VCF header and the VCF header is updated with the new annotations. For further reading and documentation see the BCFtools annotate manual.
Output files
annotation/[SAMPLE]/[SAMPLE]_BCF.ann.vcf.gz: Annotated VCF from BCF process.[SAMPLE]_BCF.ann.vcf.gz.tbi: This is the index of the above VCF file.
QC and Reporting
QC
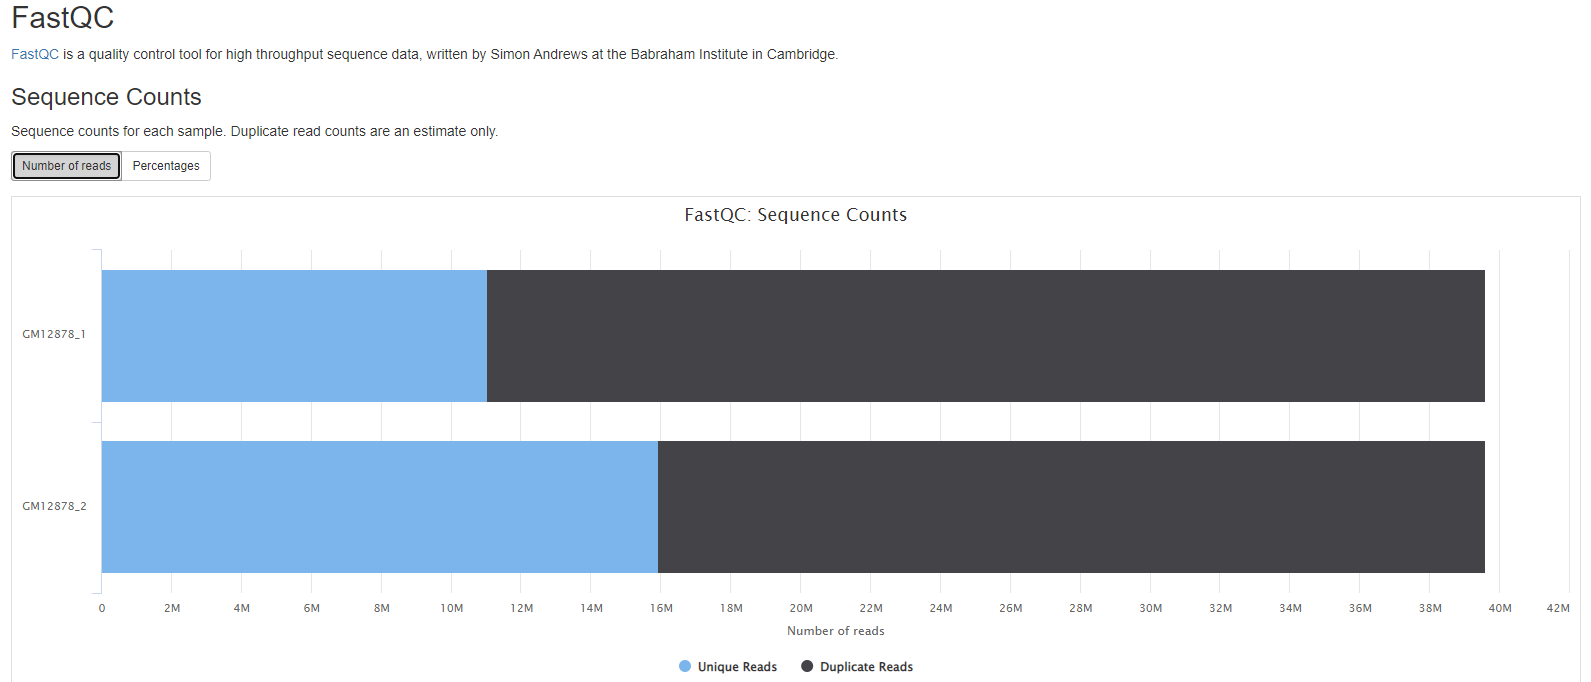
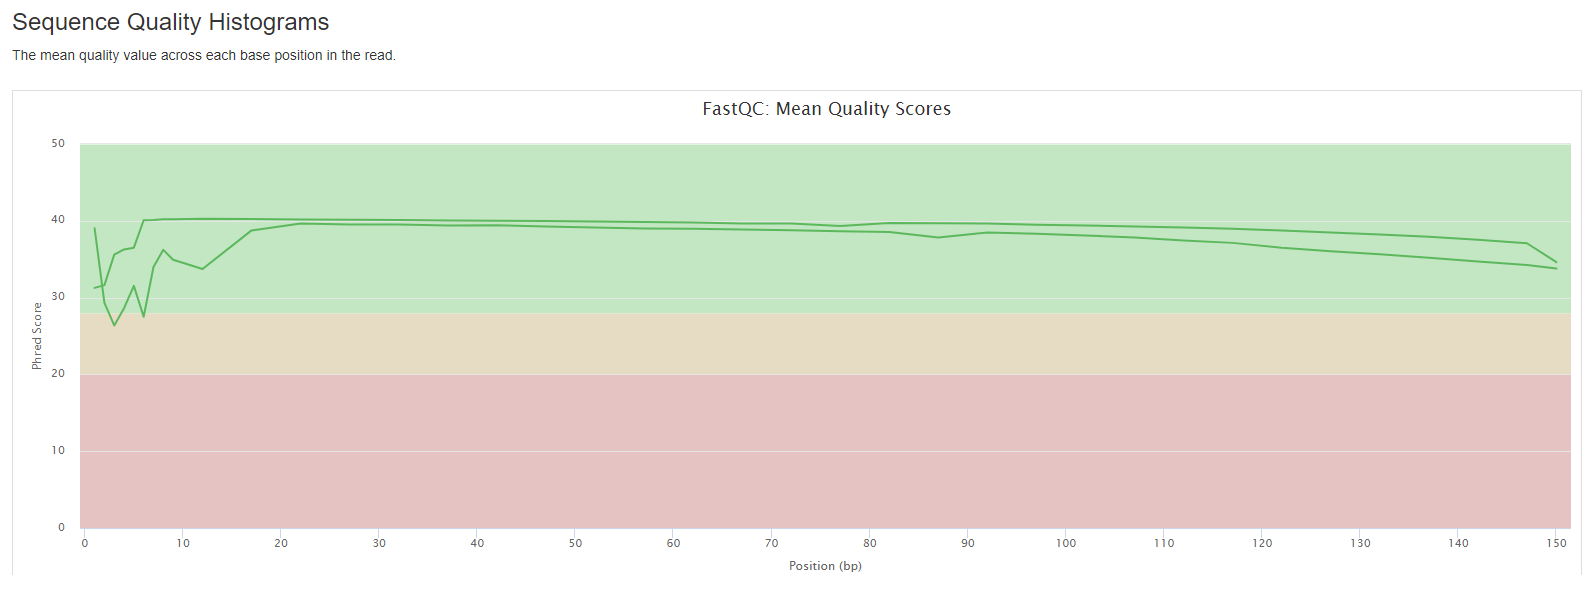
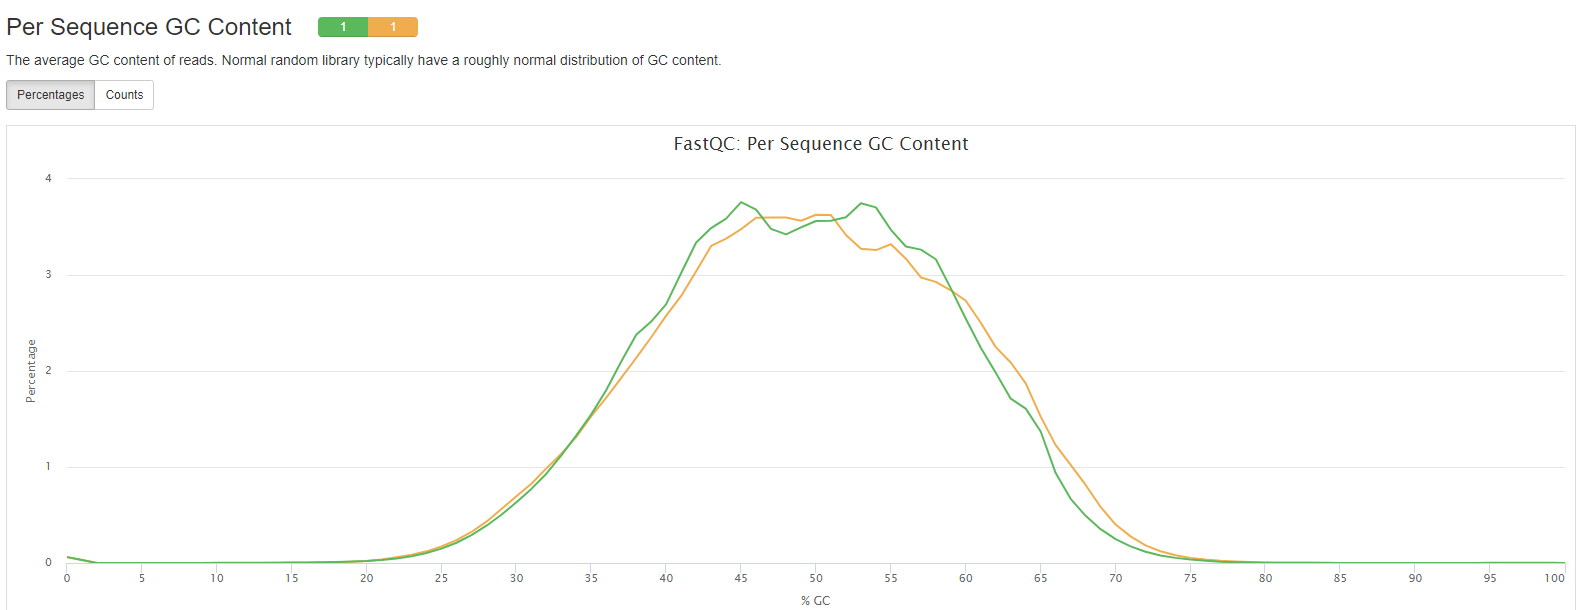
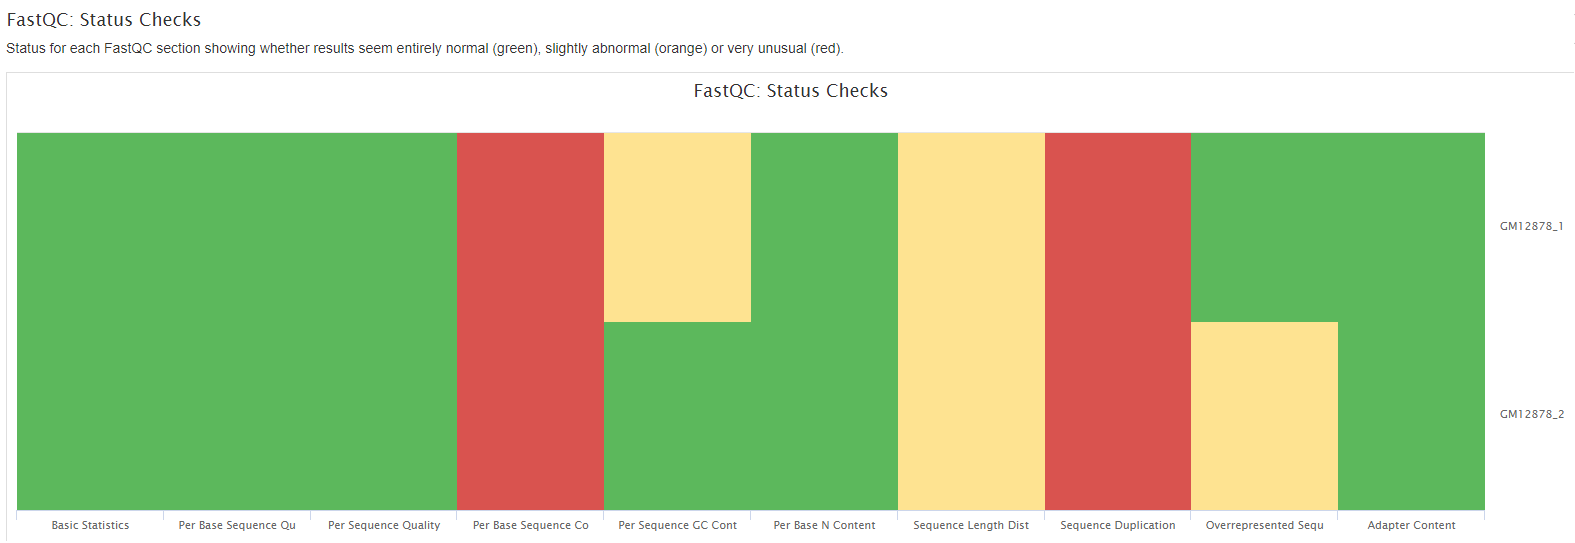
FastQC
FastQC gives general quality metrics about your sequenced reads. It provides information about the quality score distribution across your reads, per base sequence content (%A/T/G/C), adapter contamination and overrepresented sequences. For further reading and documentation see the FastQC help pages.
Plots will show:
- Sequence counts for each sample.
- Sequence Quality Histograms: The mean quality value across each base position in the read.
- Per Sequence Quality Scores: The number of reads with average quality scores. Shows if a subset of reads has poor quality.
- Per Base Sequence Content: The proportion of each base position for which each of the four normal DNA bases has been called.
- Per Sequence GC Content: The average GC content of reads. Normal random library typically have a roughly normal distribution of GC content.
- Per Base N Content: The percentage of base calls at each position for which an N was called.
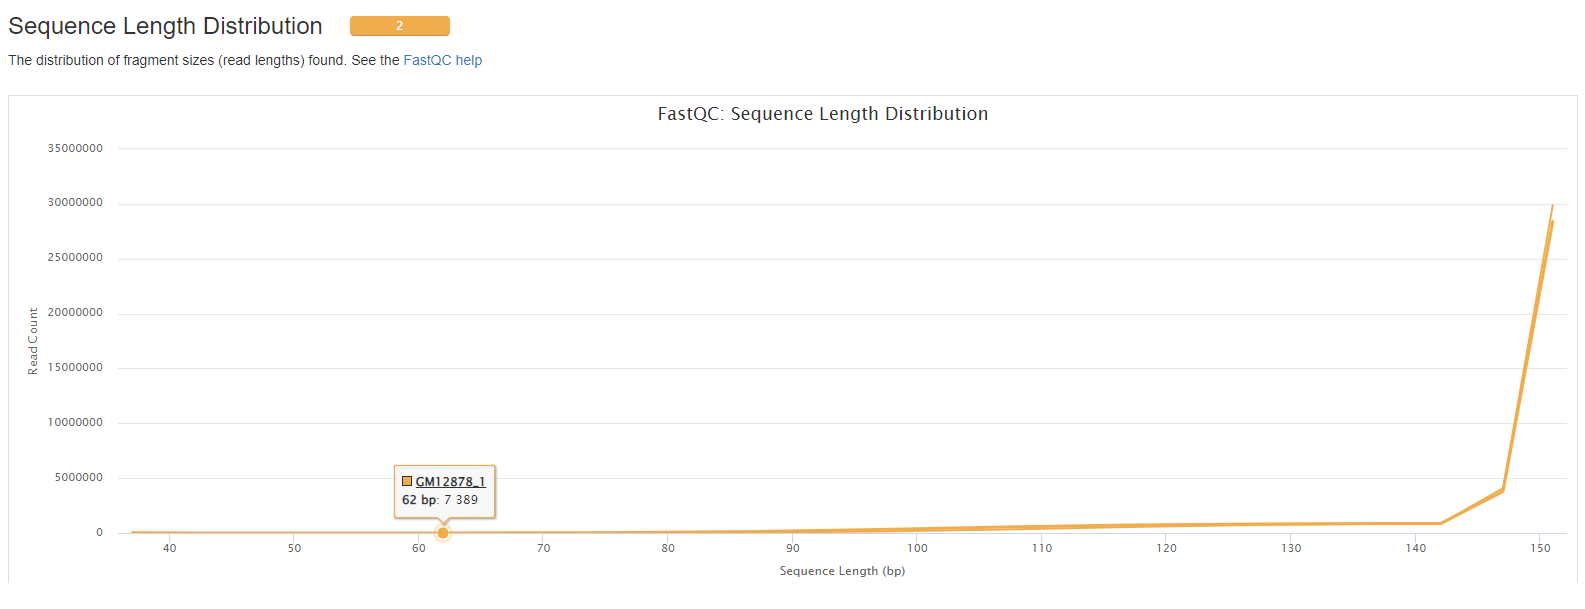
- Sequence Length Distribution.
- Sequence Duplication Levels: The relative level of duplication found for every sequence.
- Overrepresented sequences: The total amount of overrepresented sequences found in each library.
- Adapter Content: The cumulative percentage count of the proportion of your library which has seen each of the adapter sequences at each position.
Output files
reports/fastqc/[SAMPLE]/[SAMPLE]_fastqc.html: HTML report containing quality metrics for your untrimmed raw FastQ files.[SAMPLE]_fastqc.zip: Zip archive containing the HTML report, tab-delimited data file and plot images.
The FastQC plots displayed in the MultiQC report shows untrimmed reads. They may contain adapter sequence and potentially regions with low quality.
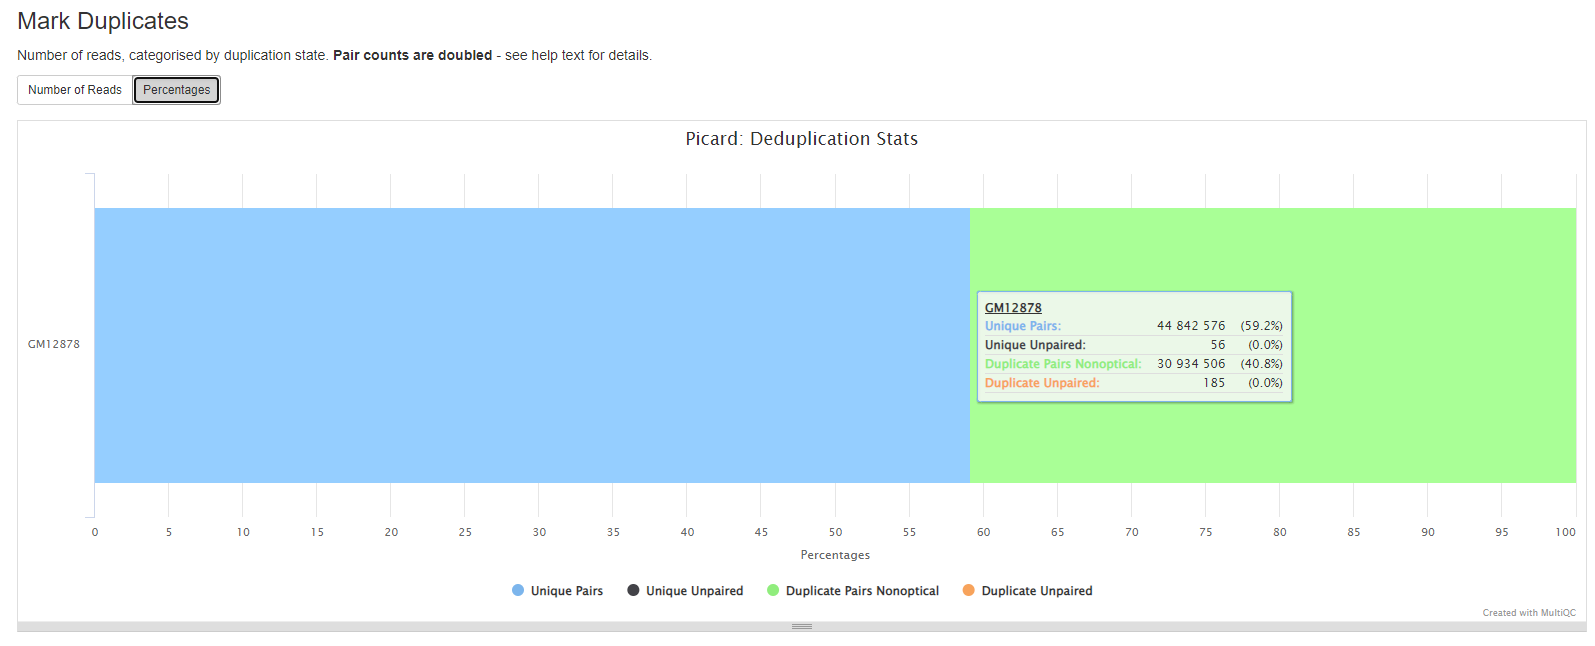
GATK MarkDuplicates reports
More information in the GATK MarkDuplicates section
Duplicates can arise during sample preparation e.g. library construction using PCR. Duplicate reads can also result from a single amplification cluster, incorrectly detected as multiple clusters by the optical sensor of the sequencing instrument. These duplication artifacts are referred to as optical duplicates.
Output files
reports/picard/[SAMPLE]/[SAMPLE].bam.md.metrics.txt: Information about the number of duplicate reads in the sample.
For further reading and documentation see the MarkDuplicates manual.
samtools stats
samtools stats collects statistics from BAM files and outputs in a text format.
Plots will show:
- Alignment metrics.
Output files
reports/samtools/[SAMPLE]/[SAMPLE].aligned.bam.flagstat: Samtools flagstat counts the number of alignments for each FLAG type[SAMPLE].aligned.bam.idxstats: Samtools idxstats reports alignment summary statistics[SAMPLE].aligned.bam.stats: Samtools stats produces comprehensive statistics from alignment file[SAMPLE].md.bam.flagstat: Samtools flagstat counts the number of alignments for each FLAG type[SAMPLE].md.bam.idxstats: Samtools idxstats reports alignment summary statistics[SAMPLE].md.bam.stats: Samtools stats produces comprehensive statistics from alignment file[SAMPLE].recal.bam.flagstat: Samtools flagstat counts the number of alignments for each FLAG type[SAMPLE].recal.bam.idxstats: Samtools idxstats reports alignment summary statistics[SAMPLE].recal.bam.stats: Samtools stats produces comprehensive statistics from alignment file
For further reading and documentation see the samtools manual
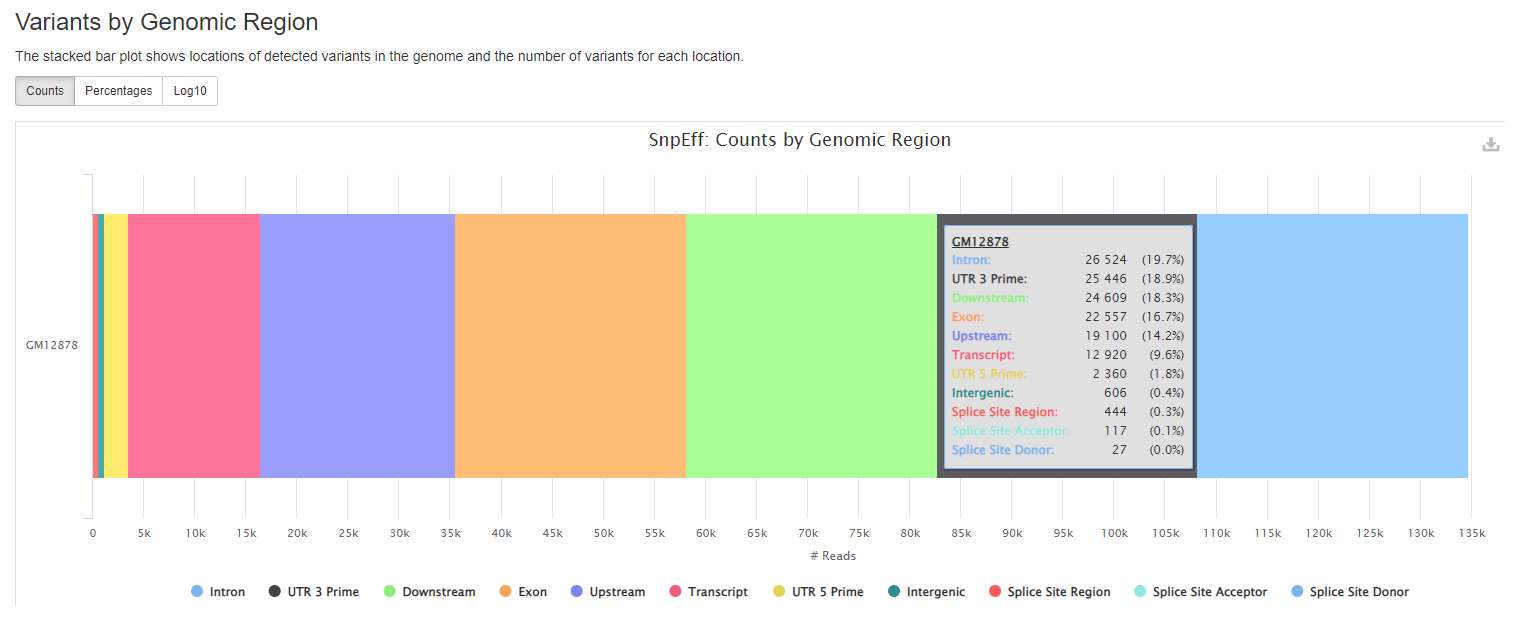
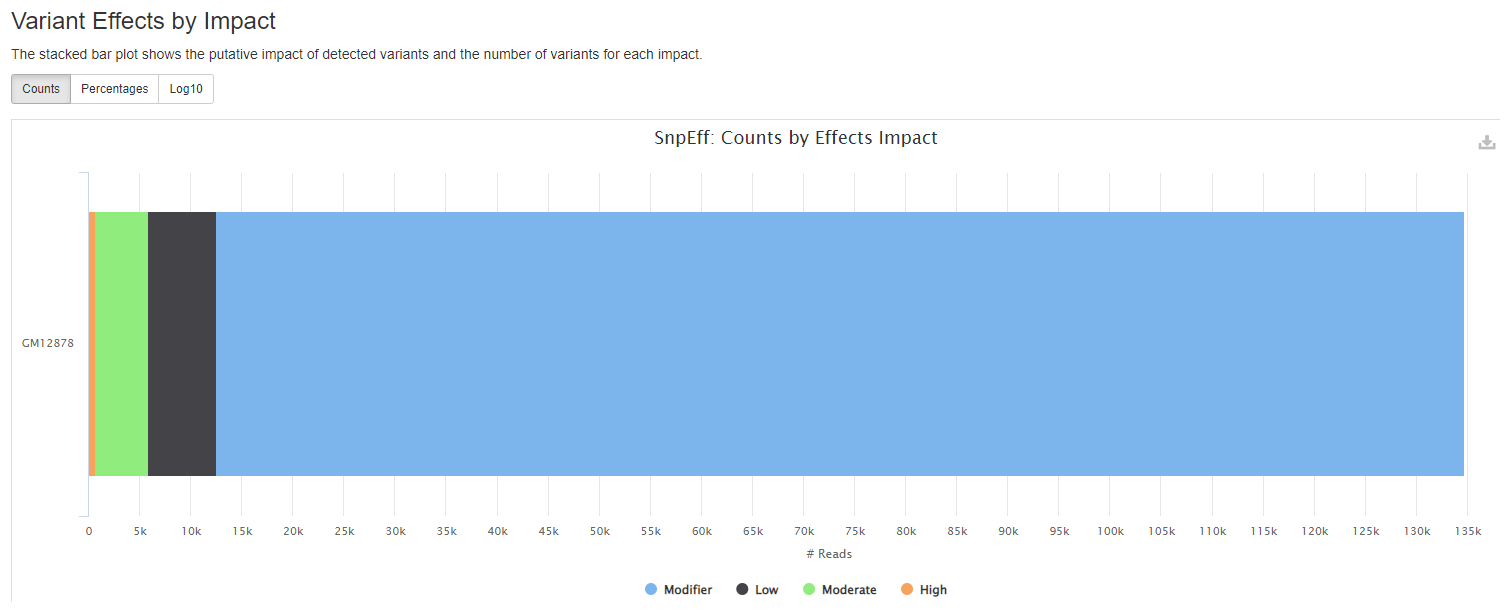
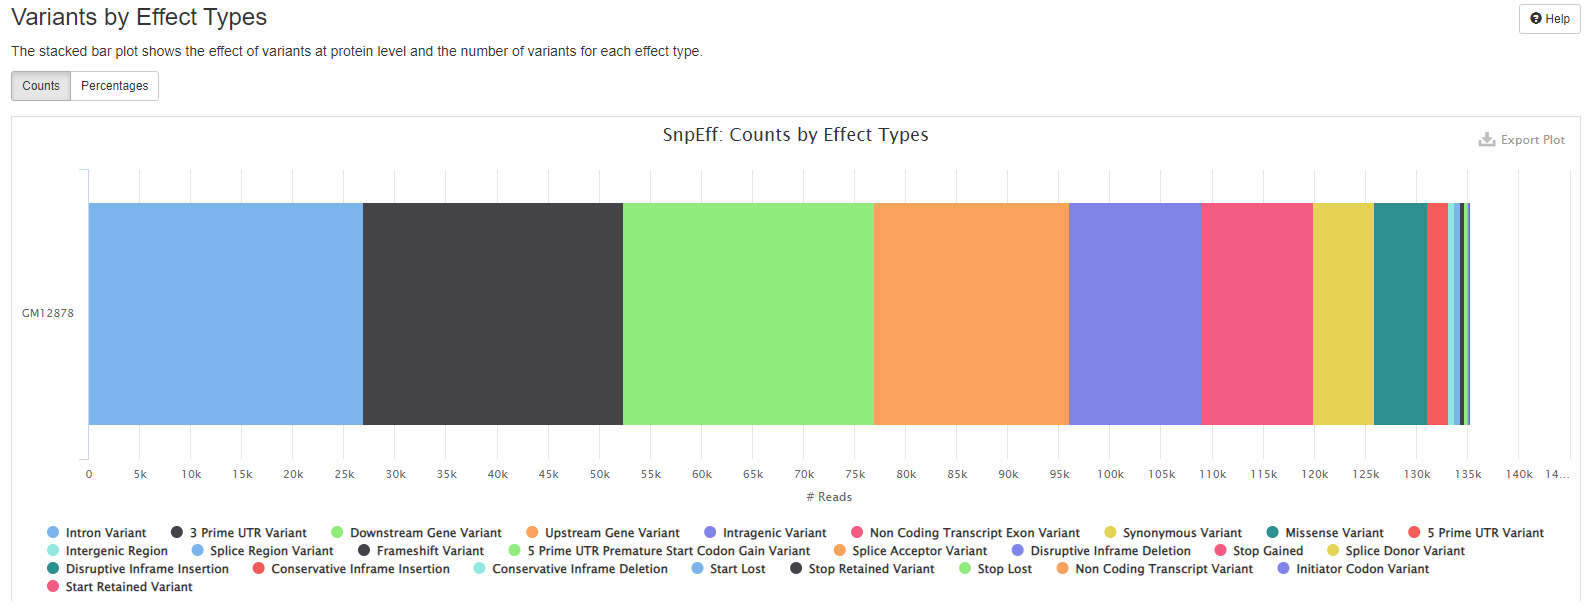
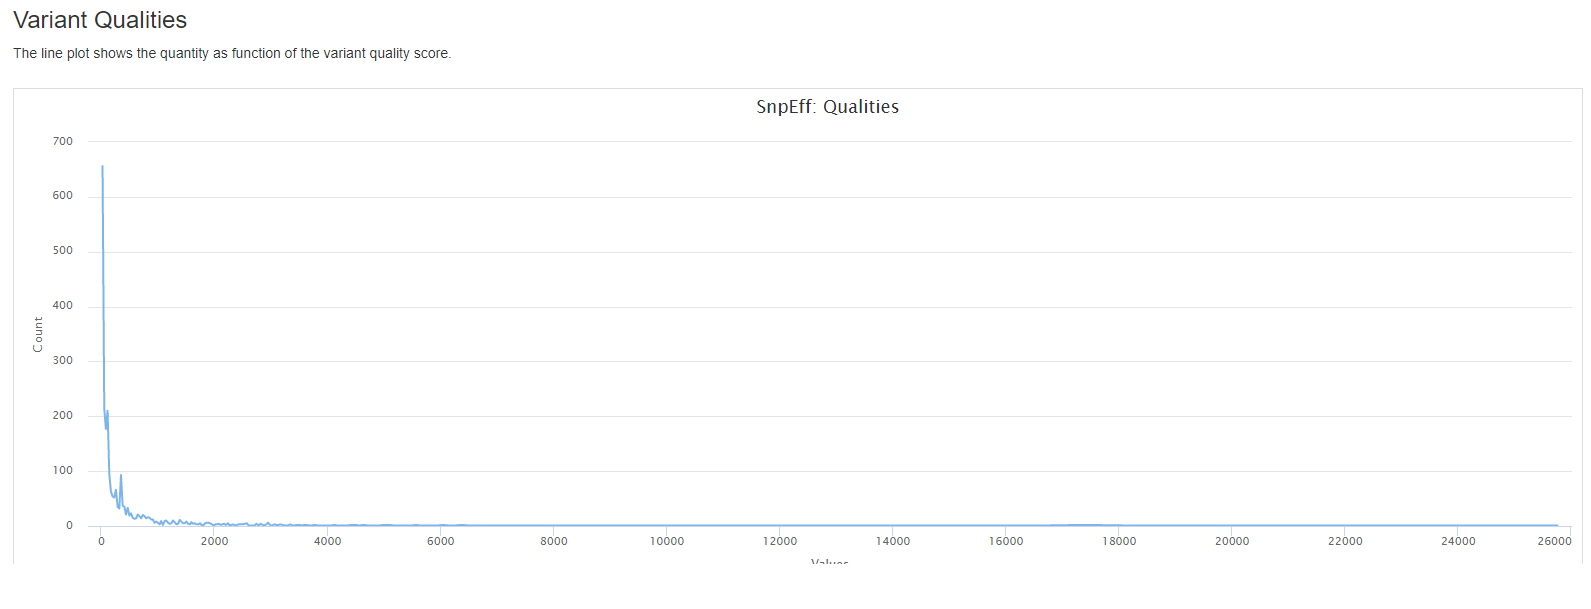
snpEff reports
snpeff is a genetic variant annotation and effect prediction toolbox. It annotates and predicts the effects of variants on genes (such as amino acid changes) using multiple databases for annotations.
Plots will shows :
- locations of detected variants in the genome and the number of variants for each location.
- the putative impact of detected variants and the number of variants for each impact.
- the effect of variants at protein level and the number of variants for each effect type.
- the quantity as function of the variant quality score.
Output files
reports/snpeff/[SAMPLE]/[SAMPLE].csv: Summary of variants by chromosome, region, effect, impact, functional class, type, etc.[SAMPLE].genes.txt: TXT (tab separated) summary counts for variants affecting each transcript and gene.snpEff_summary.html: Statistics with graphs to be viewed with a web browser
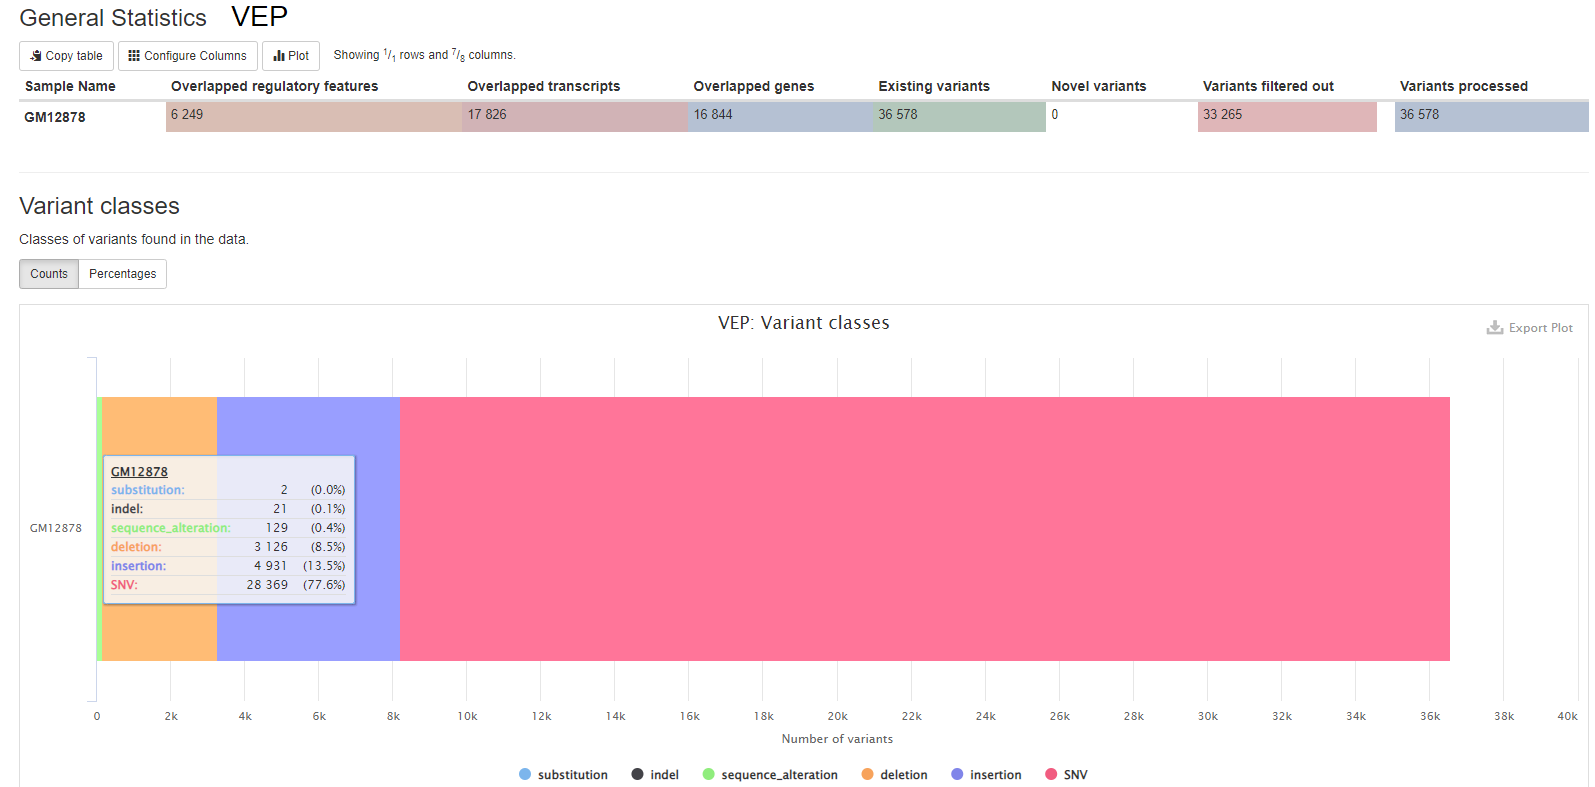
VEP reports
VEP (Variant Effect Predictor), based on Ensembl, is a tools to determine the effects of all sorts of variants, including SNPs, indels, structural variants, CNVs.
Output files
reports/ensemblvep/[SAMPLE]/[SAMPLE].summary.html: Statistics with graphs to be viewed with a web browser
For further reading and documentation see the VEP manual
Reporting
MultiQC
MultiQC is a visualization tool that generates a single HTML report summarizing all samples in your project. Most of the pipeline QC results are visualised in the report and further statistics are available in the report data directory.
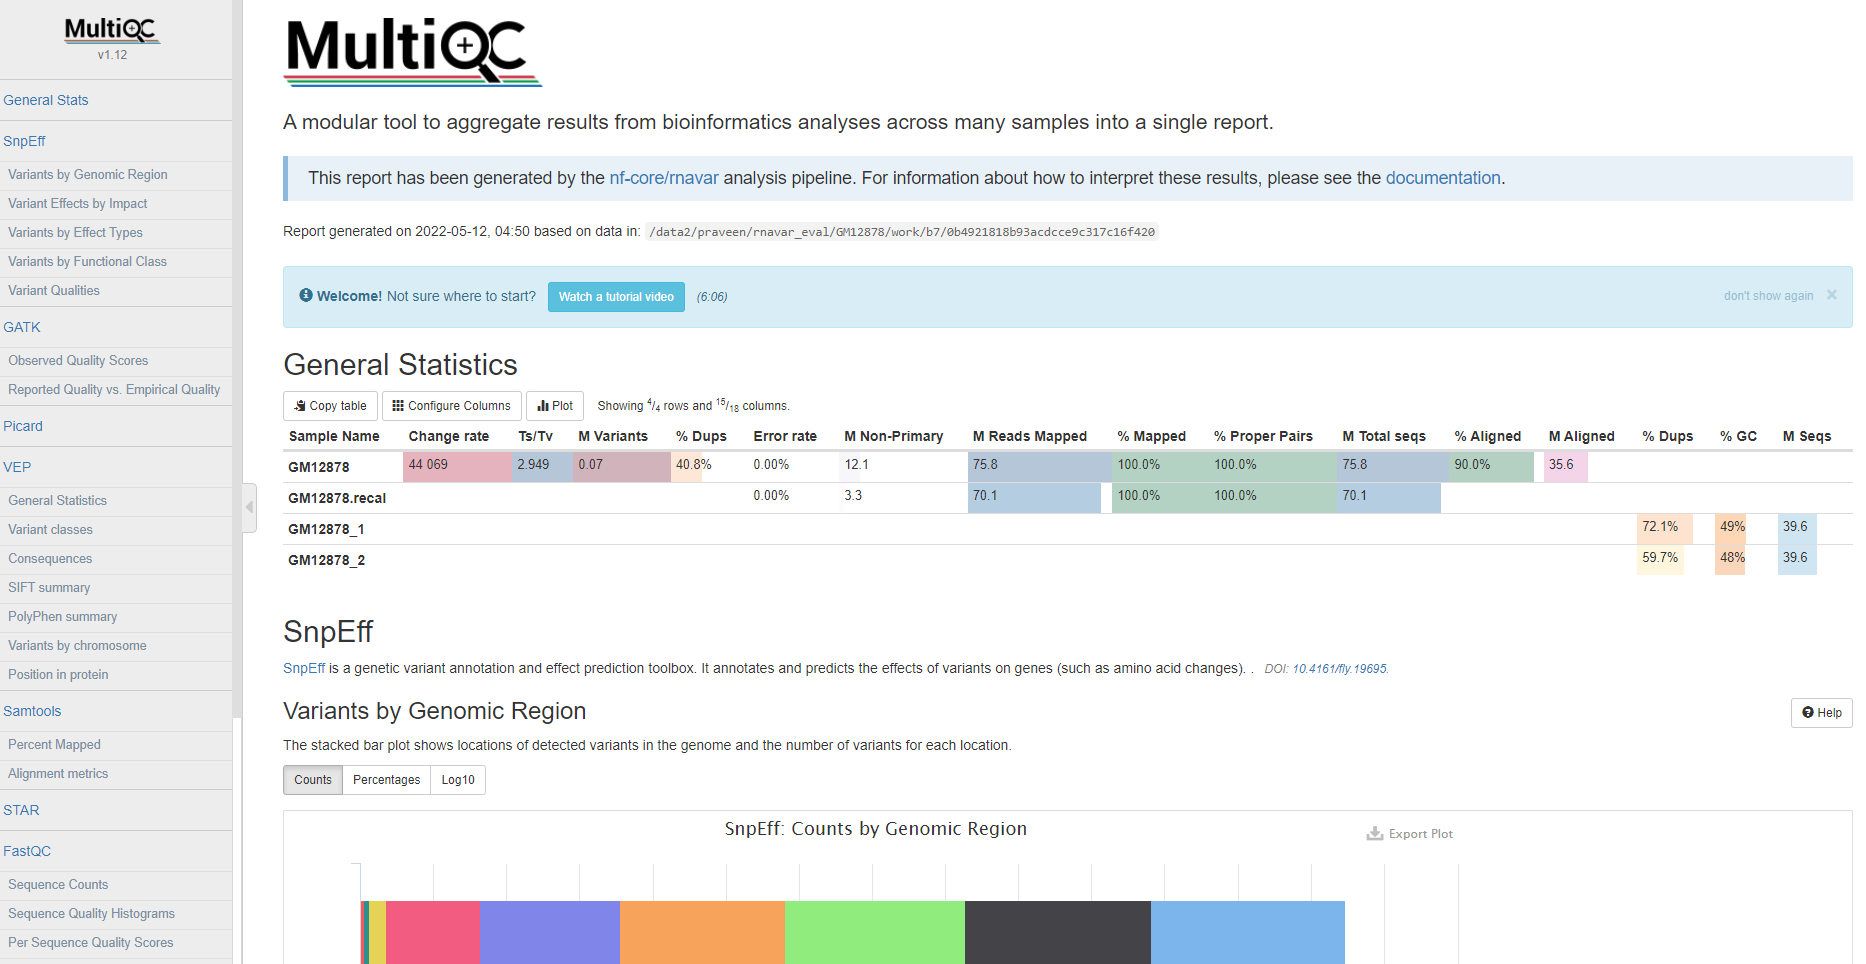
The pipeline has special steps which also allow the software versions to be reported in the MultiQC output for future traceability.
For more information about how to use MultiQC reports, see https://multiqc.info.
Output files
reports/multiqc/multiqc_report.html: a standalone HTML file that can be viewed in your web browser.multiqc_data/: directory containing parsed statistics from different tools used in the pipeline.multiqc_plots/: directory containing static images from the report in various formats.
Pipeline information
Output files
pipeline_info/- Reports generated by Nextflow:
execution_report.html,execution_timeline.html,execution_trace.txtandpipeline_dag.dot/pipeline_dag.svg. - Reports generated by the pipeline:
pipeline_report.html,pipeline_report.txtandsoftware_versions.yml. Thepipeline_report*files will only be present if the--email/--email_on_failparameter’s are used when running the pipeline. - Reformatted samplesheet files used as input to the pipeline:
samplesheet.valid.csv. - Parameters used by the pipeline run:
params.json.
- Reports generated by Nextflow:
Nextflow provides excellent functionality for generating various reports relevant to the running and execution of the pipeline. This will allow you to troubleshoot errors with the running of the pipeline, and also provide you with other information such as launch commands, run times and resource usage.