nf-core/viralrecon
Assembly and intrahost/low-frequency variant calling for viral samples
Introduction
This document describes the output produced by the pipeline. Most of the plots are taken from the MultiQC report, which summarises results at the end of the pipeline.
The directories listed below will be created in the results directory after the pipeline has finished. All paths are relative to the top-level results directory.
Nanopore: Pipeline overview
- Introduction
- Nanopore: Pipeline overview
- Pipeline information
Nanopore: Preprocessing
A file called summary_variants_metrics_mqc.csv containing a selection of read alignment and variant calling metrics will be saved in the multiqc/ output directory. The same metrics will also be added to the top of the MultiQC report.
Nanopore: pycoQC
Output files
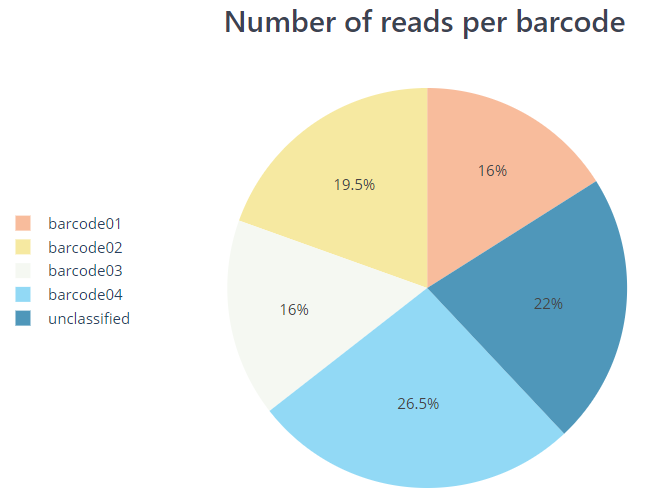
pycoqc/*.htmland.jsonfile that includes a run summary and graphical representation of various QC metrics including distribution of read length, distribution of read quality scores, mean read quality per sequence length, output per channel over experiment time and percentage of reads per barcode.
PycoQC compute metrics and generate QC plots using the sequencing summary information generated by basecalling/demultiplexing tools such as Guppy e.g. distribution of read length, read length over time, number of reads per barcode and other general stats.
Nanopore: artic guppyplex
Output files
guppyplex/*.fastq.gzfiles generated by aggregate pre-demultiplexed reads from MinKNOW/Guppy. These files are not saved by default but can be via a custom config file such as the one below.
params {
    modules {
        'nanopore_artic_guppyplex' {
            publish_files = ['fastq.gz':'']
        }
    }
}
The artic guppyplex tool from the ARTIC field bioinformatics pipeline is used to perform length filtering of the demultiplexed Nanopore reads obtained per barcode. This essentially filters out chimeric reads that may be generated by the ARTIC protocol. The pipeline uses a default minimum and maximum read length of 400 and 700, respectively as tailored for the nCoV-2019 primer set. However, you may need to adjust these for different primer schemes e.g. by using the minimum length of the amplicons (--min-length) as well as the maximum length plus 200 (--max-length).
Nanopore: NanoPlot
Output files
nanoplot/<SAMPLE>/- Per-sample
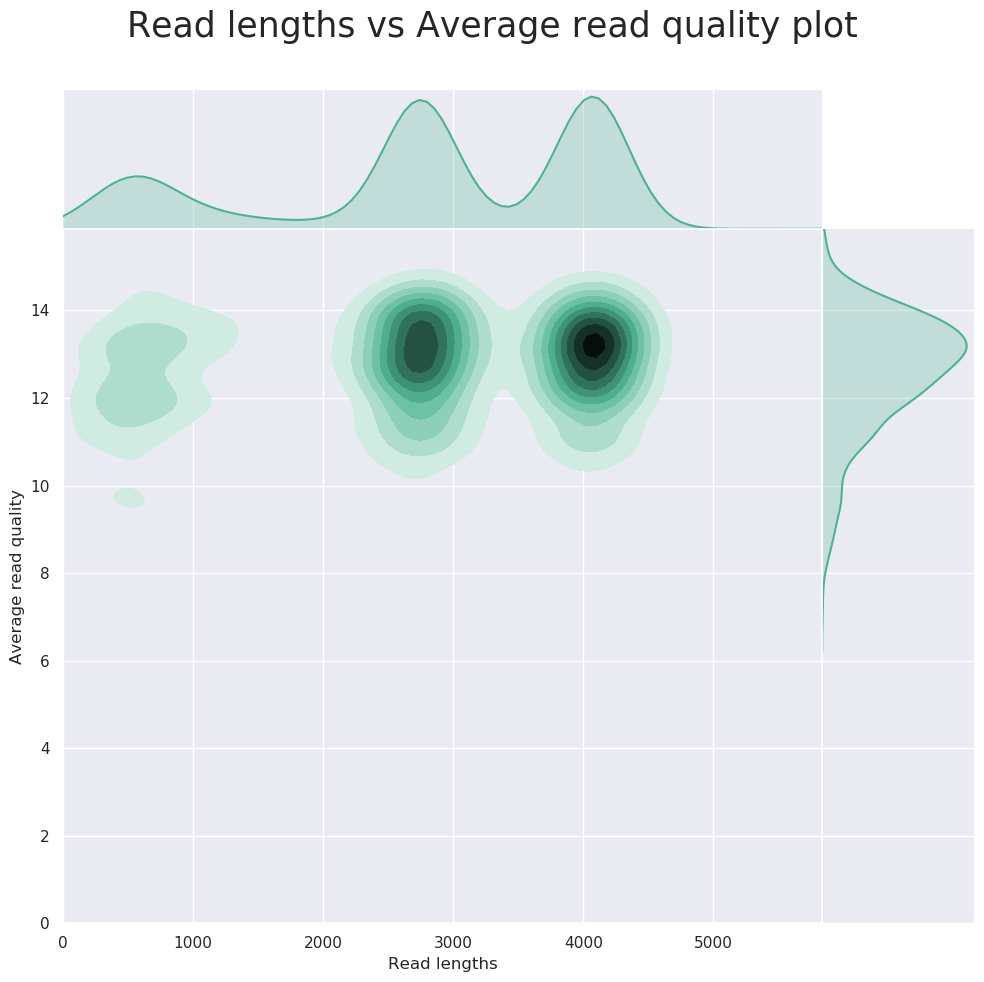
*.htmlfiles for QC metrics and individual*.pngimage files for plots.
- Per-sample
NanoPlot it a tool that can be used to produce general quality metrics from various Nanopore-based input files including fastq files e.g. quality score distribution, read lengths and other general stats.
Nanoplot: Kraken2
Output files
kraken2/*.kraken2.report.txt: Kraken 2 taxonomic report. See here for a detailed description of the format.*.classified.fastq.gz: Fastq file with reads that classified with the database.*.unclassified.fastq.gz: Fastq file with reads that were not classified with the database.
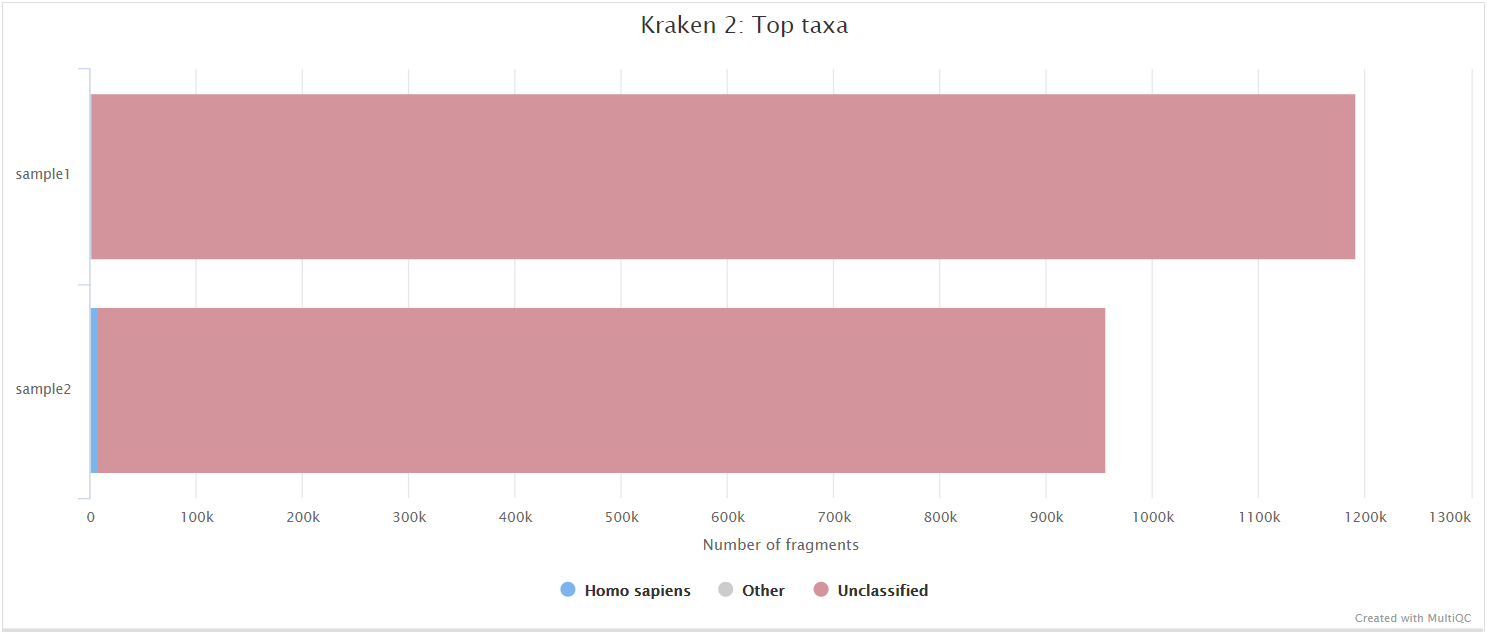
Kraken 2 is a sequence classifier that assigns taxonomic labels to DNA sequences. Kraken 2 examines the k-mers within a query sequence and uses the information within those k-mers to query a database. That database maps k-mers to the lowest common ancestor (LCA) of all genomes known to contain a given k-mer.
We use a Kraken 2 database in this workflow to filter out reads specific to the host genome before performing the de novo assembly steps in the pipeline. This filtering is not performed in the variant calling arm of the pipeline by default but Kraken 2 is still run to obtain an estimate of host reads, however, the filtering can be amended via the --kraken2_variants_host_filter parameter.
Nanopore: Variant calling
Nanopore: artic minion
Output files
<CALLER>/*.consensus.fasta: Consensus fasta file generated by artic minion.*.pass.unique.vcf.gz: VCF file containing unique variants passing quality filters.*.pass.unique.vcf.gz.tbi: VCF index file containing unique variants passing quality filters.*.pass.vcf.gz: VCF file containing variants passing quality filters.*.pass.vcf.gz.tbi: VCF index file containing variants passing quality filters.*.primers.vcf: VCF file containing variants found in primer-binding regions.*.merged.vcf: VCF file containing all detected variants.*.fail.vcf: VCF file containing variants failing quality filters.*.sorted.bam: BAM file generated by initial alignment.*.sorted.bam.bai: BAM index file generated by initial alignment.*.trimmed.rg.sorted.bam: BAM file without primer-binding site trimming.*.trimmed.rg.sorted.bam.bai: BAM index file without primer-binding site trimming.*.primertrimmed.rg.sorted.bam: BAM file generated after primer-binding site trimming.*.primertrimmed.rg.sorted.bam.bai: BAM index file generated after primer-binding site trimming.
The artic minion tool from the ARTIC field bioinformatics pipeline is used to align reads, call variants and to generate the consensus sequence. You can provide the appropriate clair3 models via the --artic_minion_model_dir parameter, else, defaults to models packaged with conda/singularity/docker installation .
Nanopore: Downstream analysis
Nanopore: SAMtools
Output files
artic_minion/*.mapped.sorted.bam: Coordinate sorted BAM file containing read alignment information.*.mapped.sorted.bam.bai: Index file for coordinate sorted BAM file.
artic_minion/samtools_stats/- SAMtools
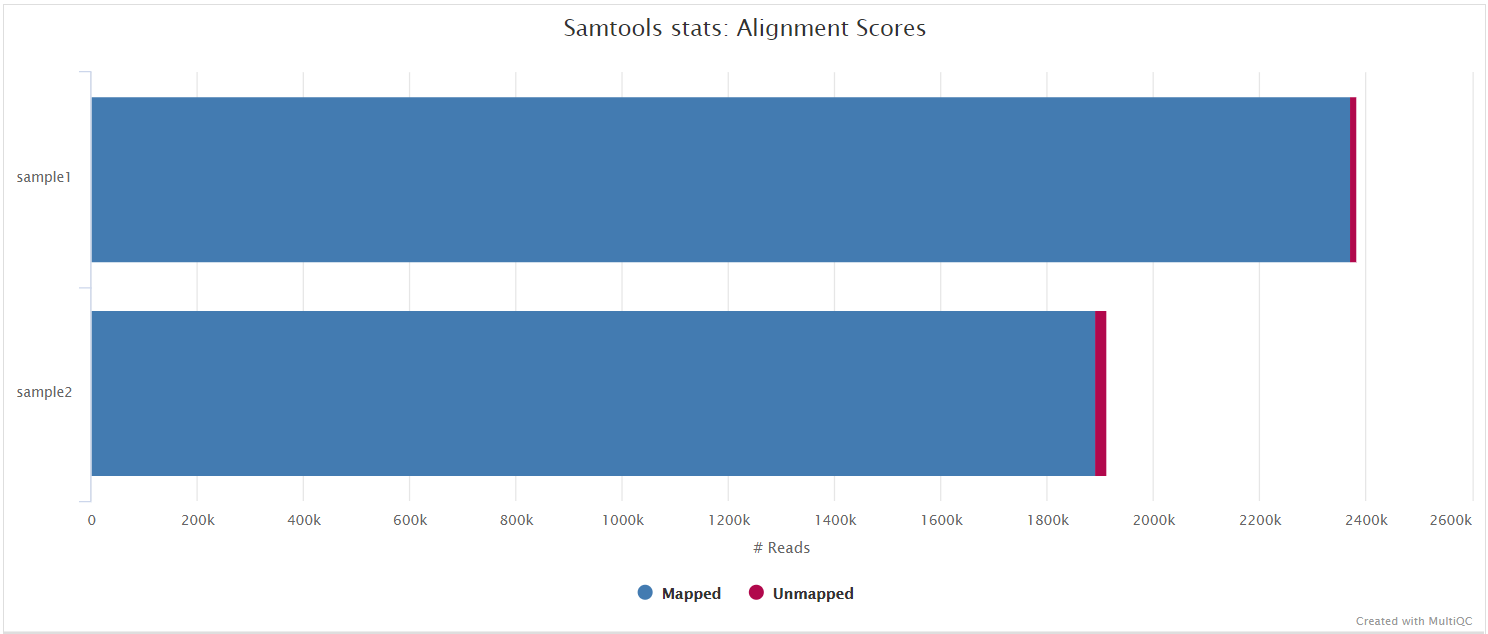
*.mapped.sorted.bam.flagstat,*.mapped.sorted.bam.idxstatsand*.mapped.sorted.bam.statsfiles generated from the alignment files.
- SAMtools
BAM files containing the original alignments from either Minimap2 or BWA are further processed with SAMtools to remove unmapped reads as well as to generate read mapping statistics.
Nanopore: mosdepth
Output files
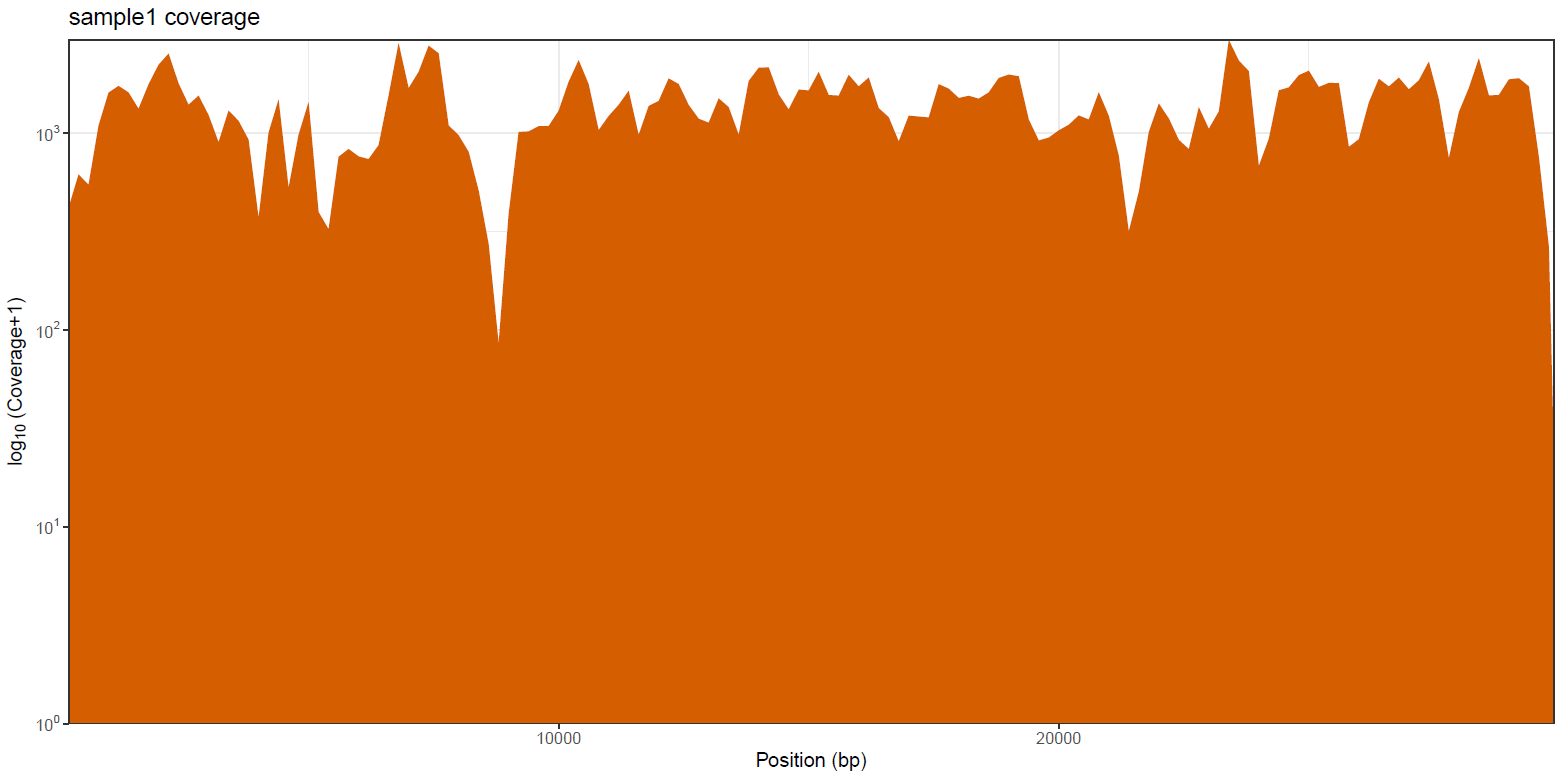
artic_minion/mosdepth/genome/all_samples.mosdepth.coverage.tsv: File aggregating genome-wide coverage values across all samples used for plotting.*.mosdepth.coverage.pdf: Whole-genome coverage plot.*.mosdepth.coverage.tsv: File containing coverage values for the above plot.*.mosdepth.summary.txt: Summary metrics including mean, min and max coverage values.
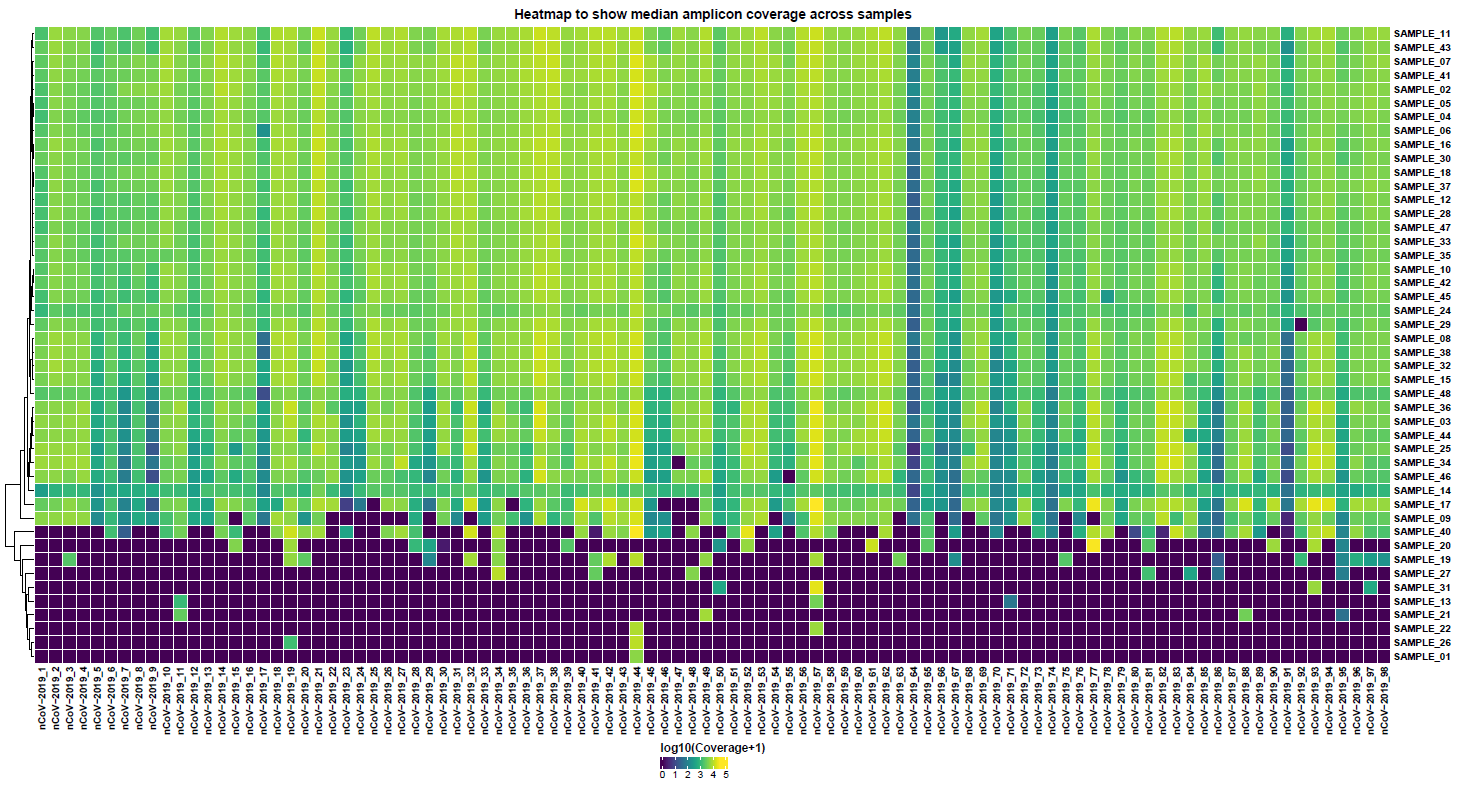
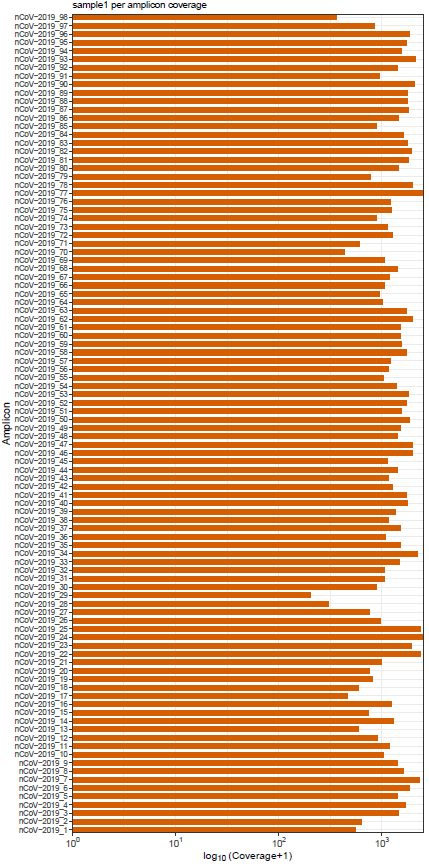
artic_minion/mosdepth/amplicon/all_samples.mosdepth.coverage.tsv: File aggregating per-amplicon coverage values across all samples used for plotting.all_samples.mosdepth.heatmap.pdf: Heatmap showing per-amplicon coverage across all samples.*.mosdepth.coverage.pdf: Bar plot showing per-amplicon coverage for an individual sample.*.mosdepth.coverage.tsv: File containing per-amplicon coverage values for the above plot.*.mosdepth.summary.txt: Summary metrics including mean, min and max coverage values.
mosdepth is a fast BAM/CRAM depth calculation for WGS, exome, or targeted sequencing. mosdepth is used in this pipeline to obtain genome-wide coverage values in 200bp windows and to obtain amplicon/region-specific coverage metrics. The results are then either rendered in MultiQC (genome-wide coverage) or are plotted using custom R scripts.
Nanopore: BCFTools
Output files
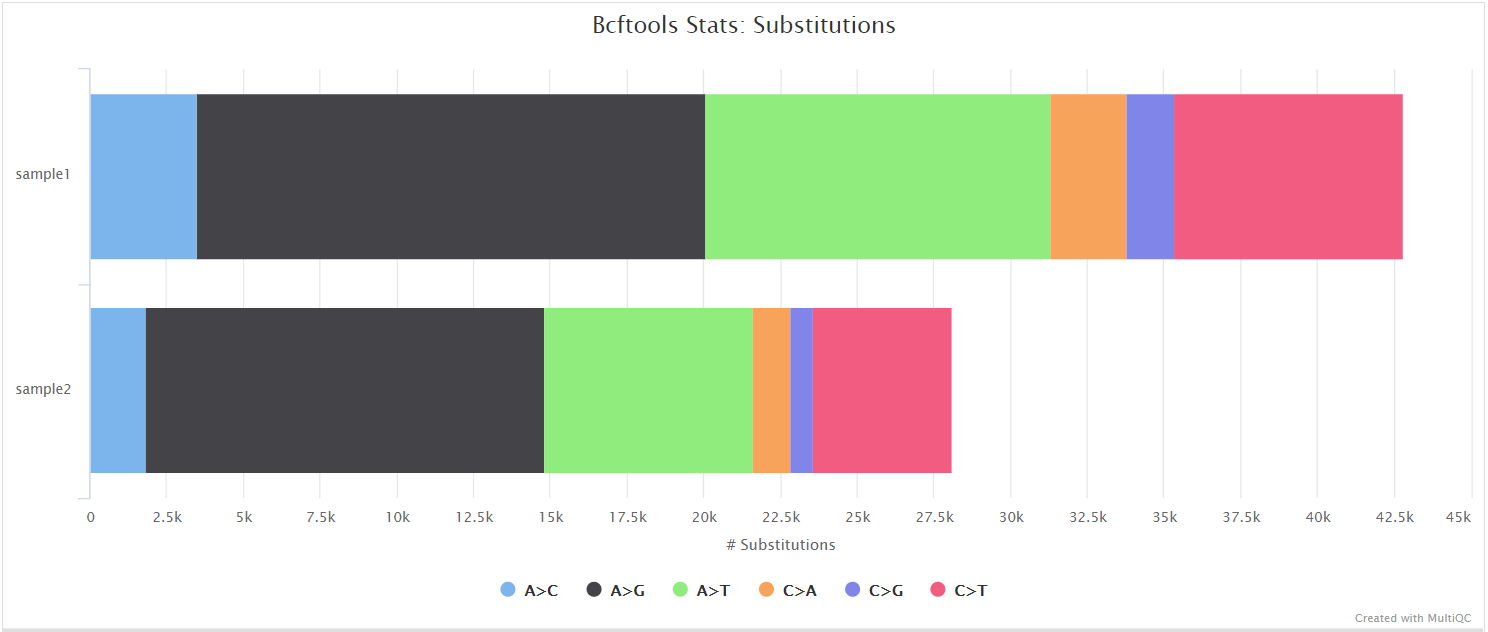
artic_minion/bcftools_stats/*.bcftools_stats.txt: Statistics and counts obtained from VCF file.
BCFtools is a set of utilities that manipulate variant calls in VCF and its binary counterpart BCF format. It can also used be used to generate statistics and counts obtained from VCF files as used here.
Nanopore: SnpEff and SnpSift
Output files
artic_minion/snpeff/*.snpeff.csv: Variant annotation csv file.*.snpeff.genes.txt: Gene table for annotated variants.*.snpeff.summary.html: Summary html file for variants.*.snpeff.vcf.gz: VCF file with variant annotations.*.snpeff.vcf.gz.tbi: Index for VCF file with variant annotations.*.snpsift.txt: SnpSift summary table.
artic_minion/snpeff/bcftools_stats/*.snpeff.bcftools_stats.txt: Statistics and counts obtained from SnpEff VCF file.
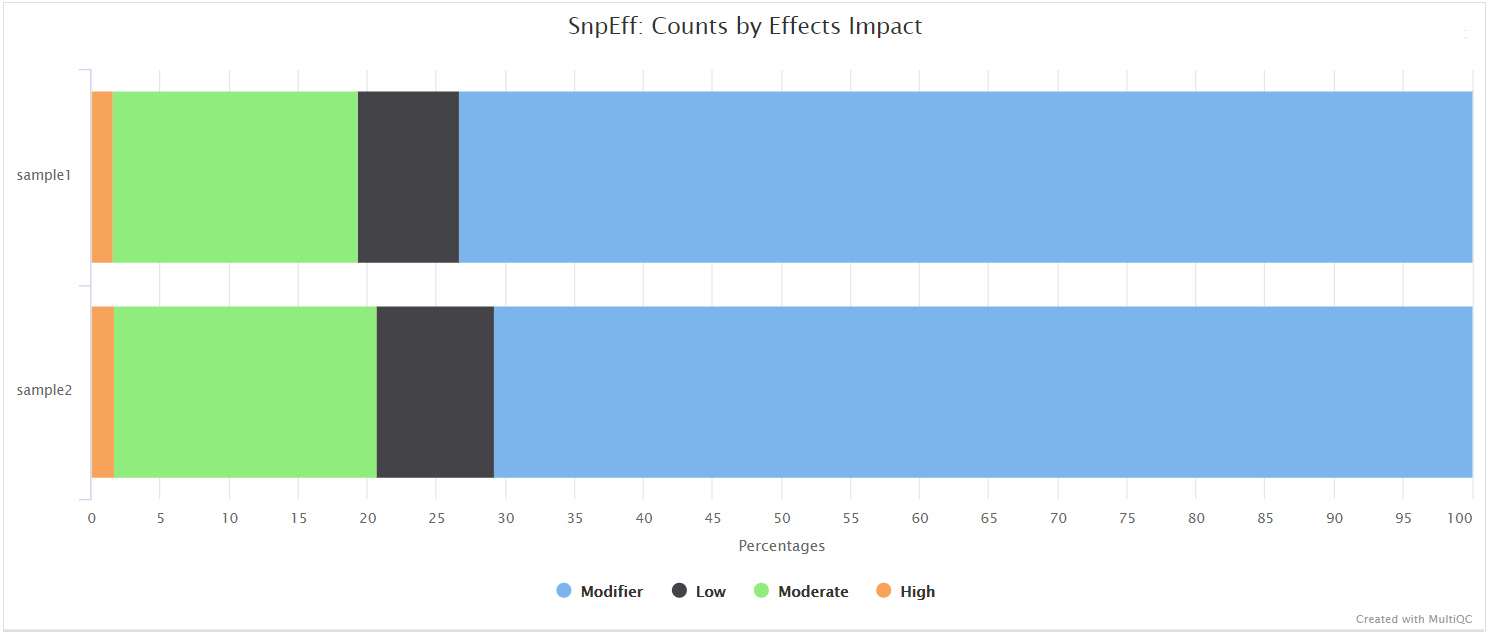
SnpEff is a genetic variant annotation and functional effect prediction toolbox. It annotates and predicts the effects of genetic variants on genes and proteins (such as amino acid changes).
SnpSift annotates genomic variants using databases, filters, and manipulates genomic annotated variants. After annotation with SnpEff, you can use SnpSift to help filter large genomic datasets in order to find the most significant variants.
Nanopore: QUAST
Output files
artic_minion/quast/report.html: Results report in HTML format. Also available in various other file formats i.e.report.pdf,report.tex,report.tsvandreport.txt.
QUAST is used to generate a single report with which to evaluate the quality of the consensus sequence across all of the samples provided to the pipeline. The HTML results can be opened within any browser (we recommend using Google Chrome). Please see the QUAST output docs for more detailed information regarding the output files.
Nanopore: Pangolin
Output files
artic_minion/pangolin/*.pangolin.csv: Lineage analysis results from Pangolin.pangolin_db: Whenpango_databaseis not provided, pangolin will attempt to auto-update its database before running the pipeline. The used database is stored in this folder and may be useful for replication. Can be given aspango_databaseinput directory.
Phylogenetic Assignment of Named Global Outbreak LINeages (Pangolin) has been used extensively during the COVID-19 pandemic to assign lineages to SARS-CoV-2 genome sequenced samples. A web application also exists that allows users to upload genome sequences via a web browser to assign lineages to genome sequences of SARS-CoV-2, view descriptive characteristics of the assigned lineage(s), view the placement of the lineage in a phylogeny of global samples, and view the temporal and geographic distribution of the assigned lineage(s).
Nanopore: Nextclade
Output files
artic_minion/nextclade/*.csv: Analysis results from Nextlade containing genome clade assignment, mutation calling and sequence quality checks.
Nextclade performs viral genome clade assignment, mutation calling and sequence quality checks for the consensus sequences generated in this pipeline. Similar to Pangolin, it has been used extensively during the COVID-19 pandemic. A web application also exists that allows users to upload genome sequences via a web browser.
Nanopore: Freyja
Output files
artic_minion/freyja/demix*.tsv: Analysis results including the lineages present, their corresponding abundances, and summarization by constellation
artic_minion/freyja/freyja_db.json: dataset containing lineage metadata that correspond to barcodes..yml: dataset containing the lineage topology..csv: dataset containing lineage defining barcodes.
artic_minion/freyja/variants*.variants.tsv: Analysis results including identified variants in a gff-like format*.depth.tsv: Analysis results including the depth of the identified variants
artic_minion/freyja/boot*lineages.csvAnalysis results inculding lineages present and their corresponding abundances with variation identified through bootstrapping*summarized.csvAnalysis results inculding lineages present but summarized by constellation and their corresponding abundances with variation identified through bootstrapping
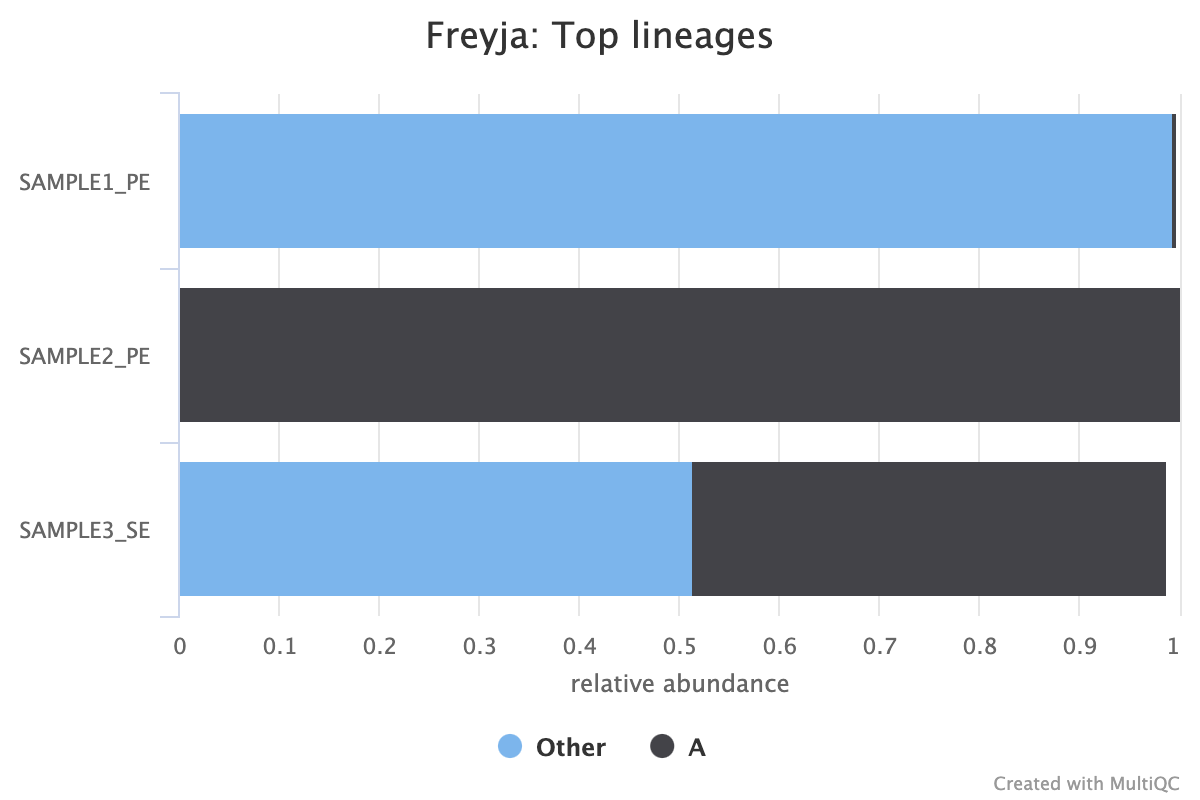
Freyja is a tool to recover relative lineage abundances from mixed SARS-CoV-2 samples from a sequencing dataset (BAM aligned to the Hu-1 reference). The method uses lineage-determining mutational “barcodes” derived from the UShER global phylogenetic tree as a basis set to solve the constrained (unit sum, non-negative) de-mixing problem.
Nanopore: Variants long table
Output files
artic_minion/variants_long_table.csv: Long format table collating per-sample information for individual variants, functional effect prediction and lineage analysis.additional_variants_long_table.csv: Long format table similar tovariants_long_table.csvfor additional annotation file with overlapping annotation features.
Create variants long format table collating per-sample information for individual variants (BCFTools), functional effect prediction (SnpSift) and lineage analysis (Pangolin). The variants used for this table are the ones passing artic minion quality filters (*.pass.unique.vcf.gz) explained before in Nanopore: artic minion output files.
The more pertinent variant information is summarised in this table to make it easier for researchers to assess the impact of variants found amongst the sequenced sample(s). An example of the fields included in the table are shown below:
SAMPLE,CHROM,POS,REF,ALT,FILTER,DP,REF_DP,ALT_DP,AF,GENE,EFFECT,HGVS_C,HGVS_P,HGVS_P_1LETTER,CALLER,LINEAGE
SAMPLE1_PE,MN908947.3,241,C,T,PASS,489,4,483,0.99,orf1ab,upstream_gene_variant,c.-25C>T,.,.,ivar,B.1
SAMPLE1_PE,MN908947.3,1875,C,T,PASS,92,62,29,0.32,orf1ab,missense_variant,c.1610C>T,p.Ala537Val,p.A537V,ivar,B.1
SAMPLE1_PE,MN908947.3,3037,C,T,PASS,213,0,213,1.0,orf1ab,synonymous_variant,c.2772C>T,p.Phe924Phe,p.F924F,ivar,B.1
SAMPLE1_PE,MN908947.3,11719,G,A,PASS,195,9,186,0.95,orf1ab,synonymous_variant,c.11454G>A,p.Gln3818Gln,p.Q3818Q,ivar,B.1
Table columns:
- SAMPLE: sample name
- CHROM: Reference/fragment ID
- POS: Position of the variant respect to the reference genome
- REF: Reference allele
- ALT: Alternative allele
- FILTER: Column indicating if the variant passed the filters. If PASS the variant passed all the filters. If not, the name of the filter that wasn’t passed will appear.
- DP: Position read depth
- REF_DP: Reference allele depth
- ALT_DP: Alternative allele depth
- AF: Alternative allele frequency
- GENE: Gene name in annotation file
- EFFECT: Effect of the variant
- HGVS_C: Position annotation at CDS level
- HGVS_P: Position annotation at protein level
- HGVS_P_1LETTER: Position annotation at protein level with the aminoacid annotation in 1 letter format
- Caller: Variant caller used
Nanopore: Workflow reporting
Nanopore: MultiQC
Output files
multiqc/multiqc_report.html: a standalone HTML file that can be viewed in your web browser.multiqc_data/: directory containing parsed statistics from the different tools used in the pipeline.summary_variants_metrics_mqc.csv: file containing a selection of read alignmnet and variant calling metrics. The same metrics will also be added to the top of the MultiQC report.

Results generated by MultiQC collate pipeline QC from pycoQC, samtools, mosdepth, BCFTools, SnpEff and QUAST.
The default multiqc config file has been written in a way in which to structure these QC metrics to make them more interpretable in the final report.
The pipeline has special steps which also allow the software versions to be reported in the MultiQC output for future traceability. For more information about how to use MultiQC reports, see http://multiqc.info.
An example MultiQC report generated from a full-sized dataset can be viewed on the nf-core website.
Illumina: Pipeline overview
- Introduction
- Illumina: Pipeline overview
- Pipeline information
Illumina: Preprocessing
cat
Output files
fastq/*.merged.fastq.gz: These files are not saved by default but can be via a custom config file such as the one below.
params {
    modules {
        'illumina_cat_fastq' {
            publish_files = null
        }
    }
}
If multiple libraries/runs have been provided for the same sample in the input samplesheet (e.g. to increase sequencing depth) then these will be merged at the very beginning of the pipeline in order to have consistent sample naming throughout the pipeline. Please refer to the usage documentation to see how to specify these samples in the input samplesheet.
FastQC
Output files
fastqc/raw/*_fastqc.html: FastQC report containing quality metrics.*_fastqc.zip: Zip archive containing the FastQC report, tab-delimited data file and plot images.
NB: The FastQC plots in this directory are generated relative to the raw, input reads. They may contain adapter sequence and regions of low quality. To see how your reads look after trimming please refer to the FastQC reports in the fastqc/trim/ directory.
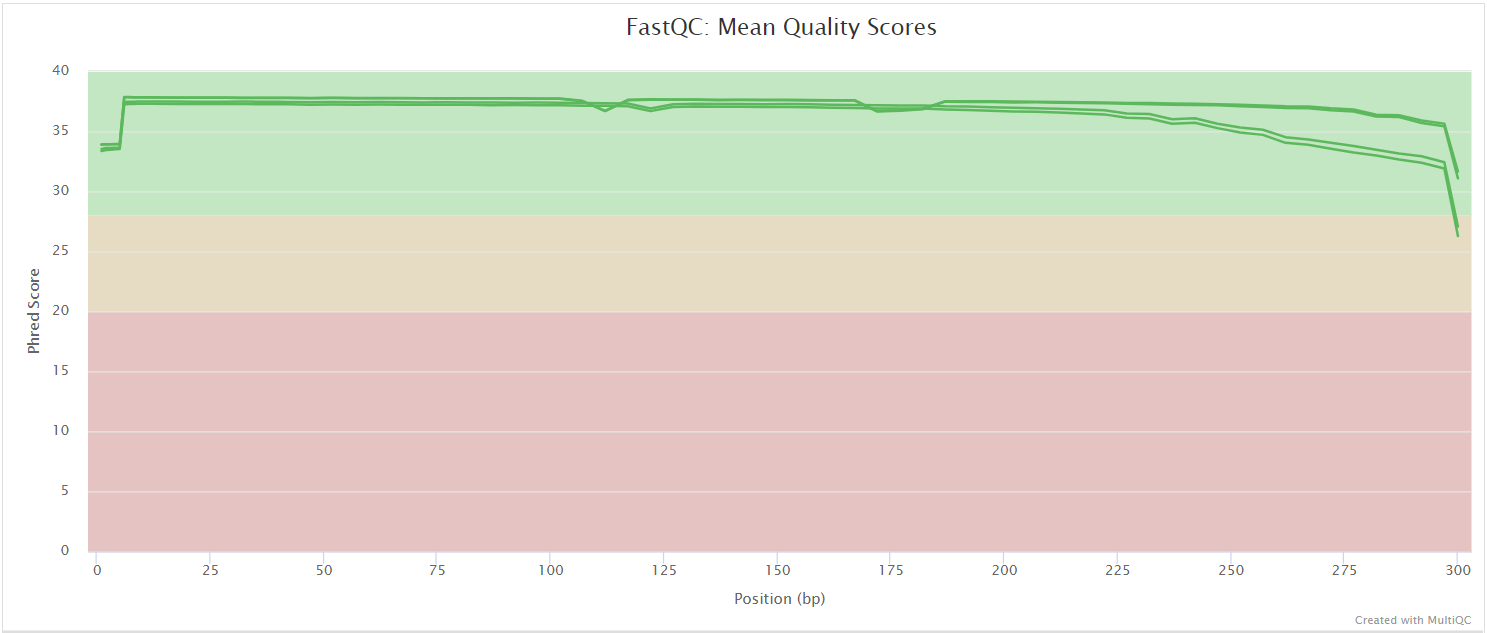
FastQC gives general quality metrics about your sequenced reads. It provides information about the quality score distribution across your reads, per base sequence content (%A/T/G/C), adapter contamination and overrepresented sequences. For further reading and documentation see the FastQC help pages.
fastp
Output files
fastp/*.fastp.html: Trimming report in html format.*.fastp.json: Trimming report in json format.
fastp/log/*.fastp.log: Trimming log file.
fastqc/trim/*_fastqc.html: FastQC report of the trimmed reads.*_fastqc.zip: Zip archive containing the FastQC report, tab-delimited data file and plot images.
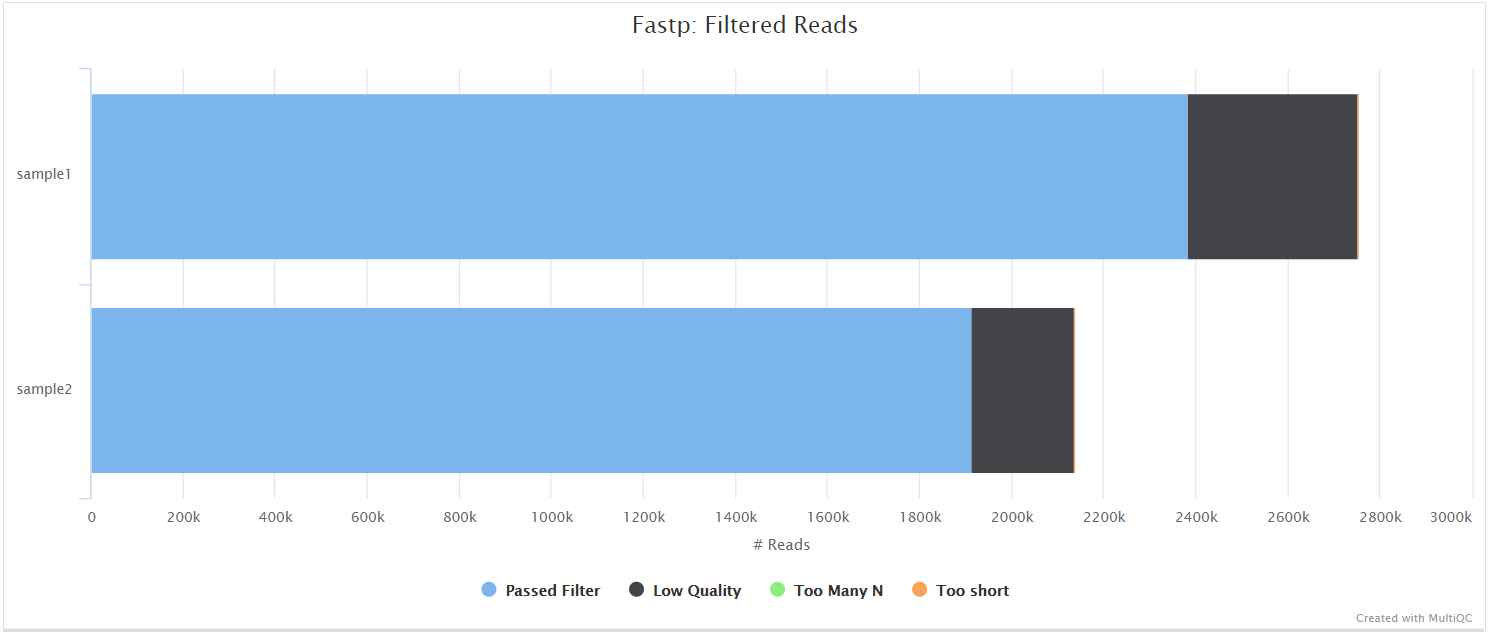
fastp is a tool designed to provide fast, all-in-one preprocessing for FastQ files. It has been developed in C++ with multithreading support to achieve higher performance. fastp is used in this pipeline for standard adapter trimming and quality filtering.
Kraken 2
Output files
kraken2/*.kraken2.report.txt: Kraken 2 taxonomic report. See here for a detailed description of the format.
Kraken 2 is a sequence classifier that assigns taxonomic labels to DNA sequences. Kraken 2 examines the k-mers within a query sequence and uses the information within those k-mers to query a database. That database maps k-mers to the lowest common ancestor (LCA) of all genomes known to contain a given k-mer.
We use a Kraken 2 database in this workflow to filter out reads specific to the host genome before performing the de novo assembly steps in the pipeline. This filtering is not performed in the variant calling arm of the pipeline by default but Kraken 2 is still run to obtain an estimate of host reads, however, the filtering can be amended via the --kraken2_variants_host_filter parameter.
Illumina: Variant calling
A file called summary_variants_metrics_mqc.csv containing a selection of read alignment and variant calling metrics will be saved in the multiqc/ results directory. The same metrics will also be added to the top of the MultiQC report.
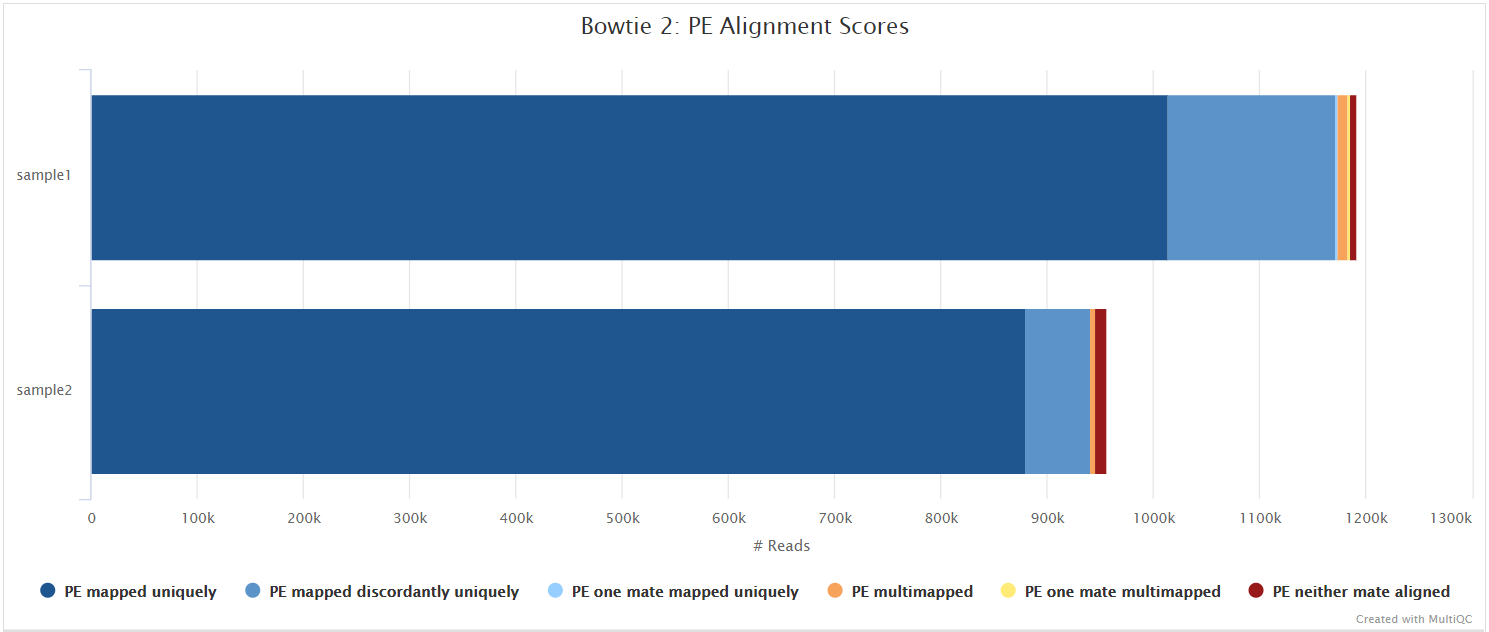
Bowtie 2
Output files
variants/bowtie2/log/*.bowtie2.log: Bowtie 2 mapping log file.
Bowtie 2 is an ultrafast and memory-efficient tool for aligning sequencing reads to long reference sequences. Bowtie 2 supports gapped, local, and paired-end alignment modes.
SAMtools
Output files
variants/bowtie2/<SAMPLE>.sorted.bam: Coordinate sorted BAM file containing read alignment information.<SAMPLE>.sorted.bam.bai: Index file for coordinate sorted BAM file.
variants/bowtie2/samtools_stats/- SAMtools
<SAMPLE>.sorted.bam.flagstat,<SAMPLE>.sorted.bam.idxstatsand<SAMPLE>.sorted.bam.statsfiles generated from the alignment files.
- SAMtools
Bowtie 2 BAM files are further processed with SAMtools to sort them by coordinate, for indexing, as well as to generate read mapping statistics.
iVar trim
Output files
variants/bowtie2/*.ivar_trim.sorted.bam: Coordinate sorted BAM file after primer trimming.*.ivar_trim.sorted.bam.bai: Index file for coordinate sorted BAM file after primer trimming.
variants/bowtie2/samtools_stats/- SAMtools
*.ivar_trim.sorted.bam.flagstat,*.ivar_trim.sorted.bam.idxstatsand*.ivar_trim.sorted.bam.statsfiles generated from the primer trimmed alignment files.
- SAMtools
variants/bowtie2/log/*.ivar_trim.ivar.log: iVar trim log file obtained from stdout.
If the --protocol amplicon parameter is provided then iVar is used to trim amplicon primer sequences from the aligned reads. iVar uses the primer positions supplied in --primer_bed to soft clip primer sequences from a coordinate sorted BAM file.
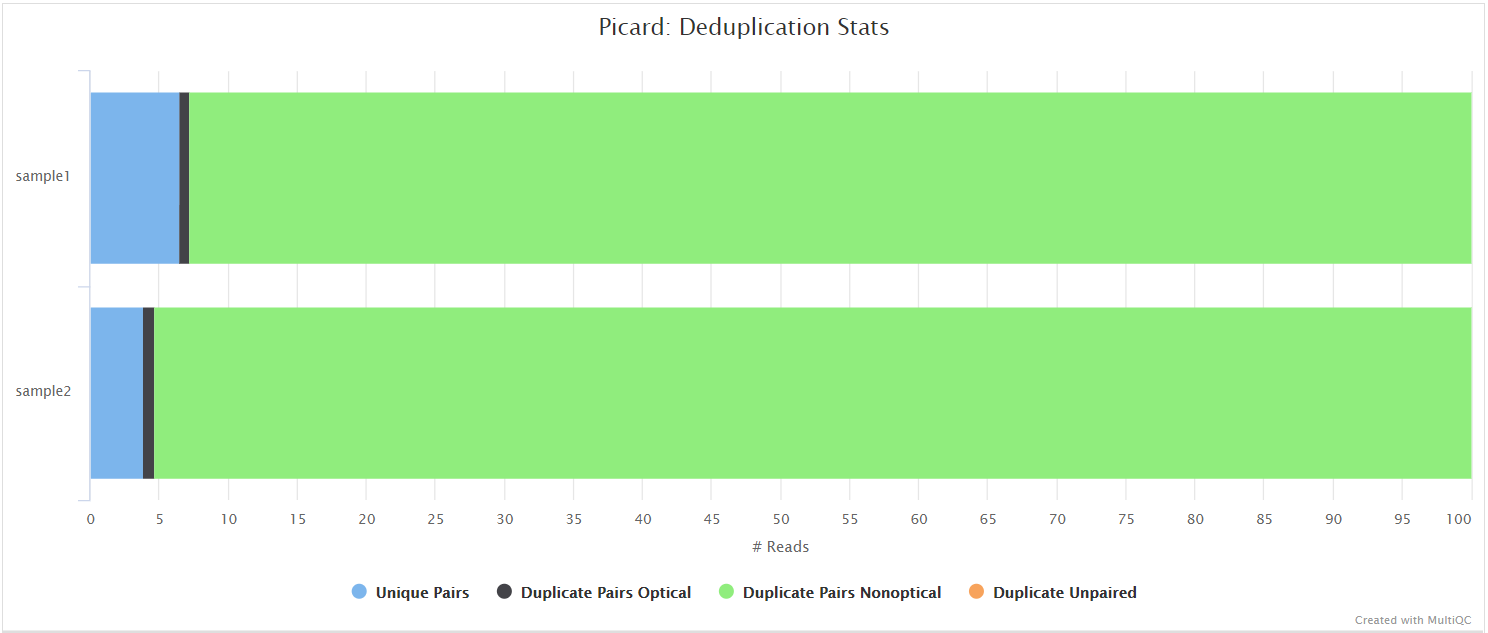
picard MarkDuplicates
Output files
variants/bowtie2/*.markduplicates.sorted.bam: Coordinate sorted BAM file after duplicate marking.*.markduplicates.sorted.bam.bai: Index file for coordinate sorted BAM file after duplicate marking.
variants/bowtie2/samtools_stats/- SAMtools
*.markduplicates.sorted.bam.flagstat,*.markduplicates.sorted.bam.idxstatsand*.markduplicates.sorted.bam.statsfiles generated from the duplicate marked alignment files.
- SAMtools
variants/bowtie2/picard_metrics/*.markduplicates.sorted.MarkDuplicates.metrics.txt: Metrics file from MarkDuplicates.
Unless you are using UMIs it is not possible to establish whether the fragments you have sequenced from your sample were derived via true biological duplication (i.e. sequencing independent template fragments) or as a result of PCR biases introduced during the library preparation. picard MarkDuplicates isn’t run by default because you anticipate high levels of duplication with viral data due to the size of the genome, however, you can activate it by adding --skip_markduplicates false to the command you use to run the pipeline. This will only mark the duplicate reads identified amongst the alignments to allow you to guage the overall level of duplication in your samples. You can also choose to remove any reads identified as duplicates via the --filter_duplicates parameter.
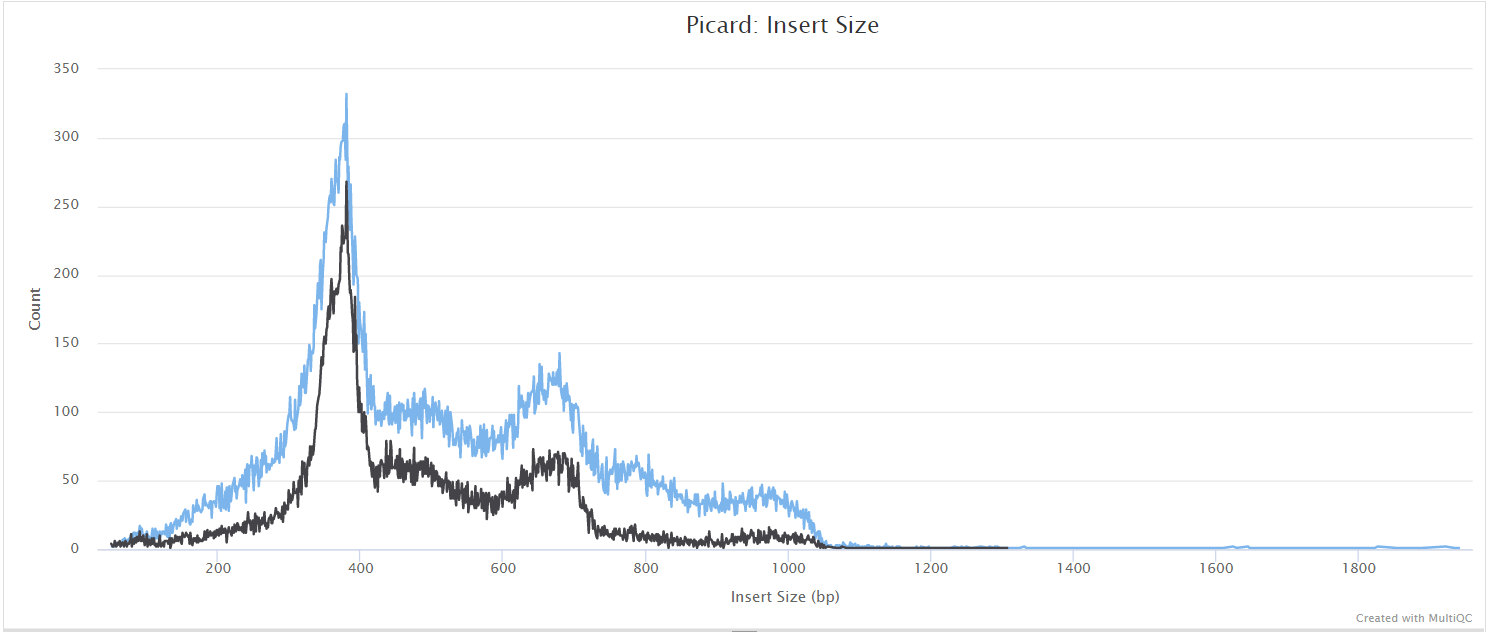
picard CollectMultipleMetrics
Output files
variants/bowtie2/picard_metrics/*.CollectMultipleMetrics.*: Alignment QC files from picard CollectMultipleMetrics in*_metricstextual format.
variants/bowtie2/picard_metrics/pdf/*.pdfplots for metrics obtained from CollectMultipleMetrics.
picard-tools is a set of command-line tools for manipulating high-throughput sequencing data. We use picard-tools in this pipeline to obtain mapping and coverage metrics.
mosdepth
Output files
variants/bowtie2/mosdepth/genome/all_samples.mosdepth.coverage.tsv: File aggregating genome-wide coverage values across all samples used for plotting.*.mosdepth.coverage.pdf: Whole-genome coverage plot.*.mosdepth.coverage.tsv: File containing coverage values for the above plot.*.mosdepth.summary.txt: Summary metrics including mean, min and max coverage values.
variants/bowtie2/mosdepth/amplicon/all_samples.mosdepth.coverage.tsv: File aggregating per-amplicon coverage values across all samples used for plotting.all_samples.mosdepth.heatmap.pdf: Heatmap showing per-amplicon coverage across all samples.*.mosdepth.coverage.pdf: Bar plot showing per-amplicon coverage for an individual sample.*.mosdepth.coverage.tsv: File containing per-amplicon coverage values for the above plot.*.mosdepth.summary.txt: Summary metrics including mean, min and max coverage values.
mosdepth is a fast BAM/CRAM depth calculation for WGS, exome, or targeted sequencing. mosdepth is used in this pipeline to obtain genome-wide coverage values in 200bp windows and for --protocol amplicon to obtain amplicon/region-specific coverage metrics. The results are then either rendered in MultiQC (genome-wide coverage) or are plotted using custom R scripts.
Freyja
Output files
variants/freyja/demix*.tsv: Analysis results including the lineages present, their corresponding abundances, and summarization by constellation
variants/freyja/freyja_db.json: dataset containing lineage metadata that correspond to barcodes..yml: dataset containing the lineage topology.barcodes.feather: dataset containing lineage defining barcodes.
variants/freyja/variants*.variants.tsv: Analysis results including identified variants in a gff-like format*.depth.tsv: Analysis results including the depth of the identified variants
variants/freyja/bootstrap*lineages.csvAnalysis results inculding lineages present and their corresponding abundances with variation identified through bootstrapping*summarized.csvAnalysis results inculding lineages present but summarized by constellation and their corresponding abundances with variation identified through bootstrapping
Freyja is a tool to recover relative lineage abundances from mixed SARS-CoV-2 samples from a sequencing dataset (BAM aligned to the Hu-1 reference). The method uses lineage-determining mutational “barcodes” derived from the UShER global phylogenetic tree as a basis set to solve the constrained (unit sum, non-negative) de-mixing problem.
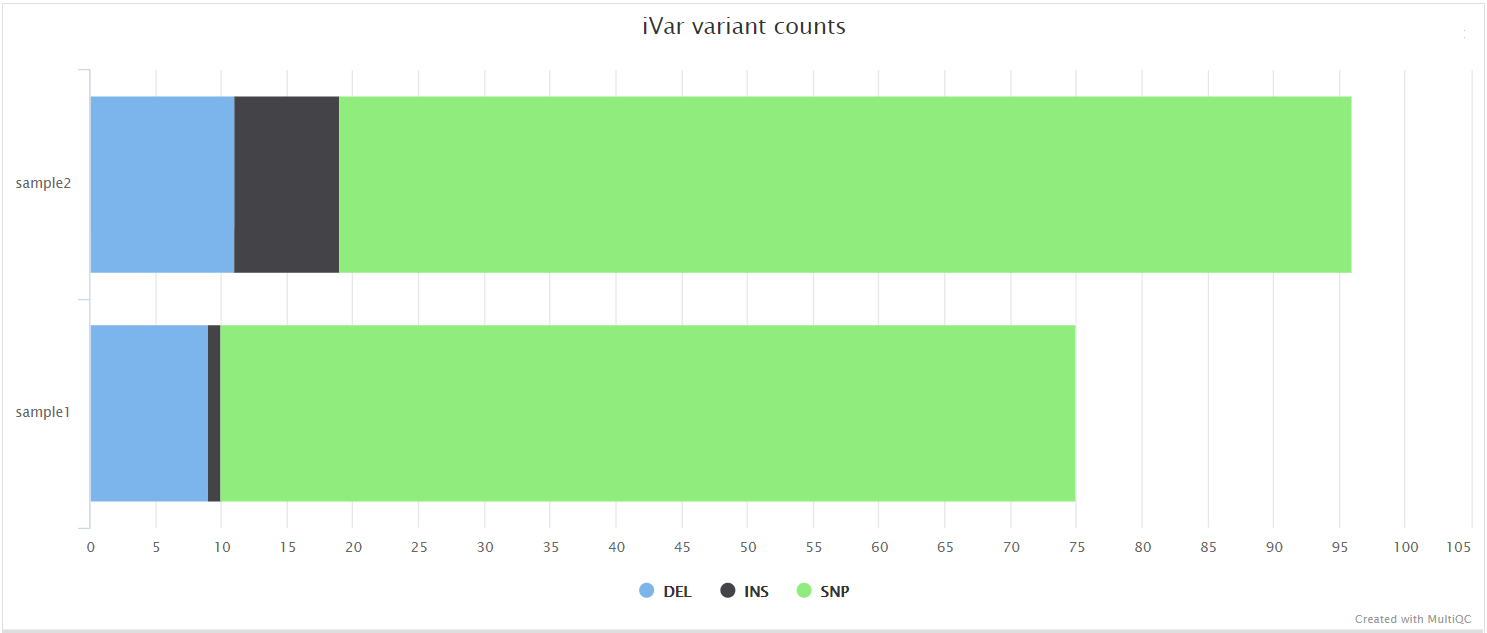
iVar variants
Output files
variants/ivar/*.tsv: Original iVar variants in TSV format.*.vcf.gz: iVar variants in VCF format. Converted using customivar_variants_to_vcf.pypython script.*.vcf.gz.tbi: iVar variants VCF index file.
variants/ivar/log/*.variant_counts.log: Counts for type of variants called by iVar.
variants/ivar/bcftools_stats/*.bcftools_stats.txt: Statistics and counts obtained from iVar variants VCF file.
iVar is a computational package that contains functions broadly useful for viral amplicon-based sequencing. We use iVar in this pipeline to trim primer sequences for amplicon input data as well as to call variants.
iVar outputs a tsv format which is not compatible with downstream analysis such as annotation using SnpEff. Moreover some issues need to be addressed such as strand-bias filtering and the consecutive reporting of variants belonging to the same codon. This pipeline uses a custom Python script ivar_variants_to_vcf.py to convert the default iVar output to VCF whilst also addressing both of these issues.
BCFTools call
Output files
variants/bcftools/*.vcf.gz: Variants VCF file.*.vcf.gz.tbi: Variants VCF index file.
variants/bcftools/bcftools_stats/*.bcftools_stats.txt: Statistics and counts obtained from VCF file.
BCFtools can be used to call variants directly from BAM alignment files. It is a set of utilities that manipulate variant calls in VCF and its binary counterpart BCF format. BCFTools is used in the variant calling and de novo assembly steps of this pipeline to obtain basic statistics from the VCF output.
SnpEff and SnpSift
Output files
variants/<CALLER>/snpeff/*.snpeff.csv: Variant annotation csv file.*.snpeff.genes.txt: Gene table for annotated variants.*.snpeff.summary.html: Summary html file for variants.*.snpeff.vcf.gz: VCF file with variant annotations.*.snpeff.vcf.gz.tbi: Index for VCF file with variant annotations.*.snpsift.txt: SnpSift summary table.
variants/<CALLER>/snpeff/bcftools_stats/*.bcftools_stats.txt: Statistics and counts obtained from VCF file.
NB: The value of <CALLER> in the output directory name above is determined by the --variant_caller parameter (Default: ‘ivar’ for ‘—protocol amplicon’ and ‘bcftools’ for ‘—protocol metagenomic’).
SnpEff is a genetic variant annotation and functional effect prediction toolbox. It annotates and predicts the effects of genetic variants on genes and proteins (such as amino acid changes).
SnpSift annotates genomic variants using databases, filters, and manipulates genomic annotated variants. After annotation with SnpEff, you can use SnpSift to help filter large genomic datasets in order to find the most significant variants.
iVar consensus
Output files
variants/<CALLER>/consensus/ivar/*.consensus.fa: Consensus Fasta file generated by iVar.*.consensus.qual.txt: File with the average quality of each base in the consensus sequence.
variants/<CALLER>/consensus/ivar/base_qc/*.ACTG_density.pdf: Plot showing density of ACGT bases within the consensus sequence.*.base_counts.pdf: Plot showing frequency and percentages of all bases in consensus sequence.*.base_counts.tsv: File containing frequency and percentages of all bases in consensus sequence.*.N_density.pdf: Plot showing density of N bases within the consensus sequence.*.N_run.tsv: File containing start positions and width of N bases in consensus sequence.
NB: The value of <CALLER> in the output directory name above is determined by the --variant_caller parameter (Default: ‘ivar’ for ‘—protocol amplicon’ and ‘bcftools’ for ‘—protocol metagenomic’).
As described in the iVar variants section, iVar can be used in this pipeline to call variants and for the consensus sequence generation.
BCFTools and BEDTools
Output files
variants/<CALLER>/consensus/bcftools/*.consensus.fa: Consensus fasta file generated by integrating the high allele-frequency variants called by iVar/BCFTools into the reference genome.*.filtered.vcf.gz: VCF file containing high allele-frequency variants (default:>= 0.75) that were integrated into the consensus sequence.*.filtered.vcf.gz.tbi: Variants VCF index file for high allele frequency variants.
variants/<CALLER>/consensus/bcftools/base_qc/*.ACTG_density.pdf: Plot showing density of ACGT bases within the consensus sequence.*.base_counts.pdf: Plot showing frequency and percentages of all bases in consensus sequence.*.base_counts.tsv: File containing frequency and percentages of all bases in consensus sequence.*.N_density.pdf: Plot showing density of N bases within the consensus sequence.*.N_run.tsv: File containing start positions and width of N bases in consensus sequence.
NB: The value of <CALLER> in the output directory name above is determined by the --variant_caller parameter (Default: ‘ivar’ for ‘—protocol amplicon’ and ‘bcftools’ for ‘—protocol metagenomic’).
BCFTools is used in the variant calling and de novo assembly steps of this pipeline to obtain basic statistics from the VCF output. It can also used be used to generate a consensus sequence by integrating variant calls into the reference genome. In this pipeline, we use samtools mpileup to create a mask using low coverage positions, and bedtools maskfasta to mask the genome sequences based on these intervals. Finally, bcftools consensus is used to generate the consensus by projecting the high allele frequency variants onto the masked genome reference sequence.
QUAST
Output files
variants/<VARIANT_CALLER>/consensus/<CONSENSUS_CALLER>/quast.consensus/report.html: Results report in HTML format. Also available in various other file formats i.e.report.pdf,report.tex,report.tsvandreport.txt.
NB: The value of <VARIANT_CALLER> in the output directory name above is determined by the --variant_caller parameter (Default: ‘ivar’ for ‘—protocol amplicon’ and ‘bcftools’ for ‘—protocol metagenomic’).
NB: The value of <CONSENSUS_CALLER> in the output directory name above is determined by the --consensus_caller parameter (Default: ‘bcftools’ for both ‘—protocol amplicon’ and ‘—protocol metagenomic’).
QUAST is used to generate a single report with which to evaluate the quality of the consensus sequence across all of the samples provided to the pipeline. The HTML results can be opened within any browser (we recommend using Google Chrome). Please see the QUAST output docs for more detailed information regarding the output files.
Pangolin
Output files
variants/<VARIANT_CALLER>/consensus/<CONSENSUS_CALLER>/pangolin/*.pangolin.csv: Lineage analysis results from Pangolin.pangolin_db: Whenpango_databaseis not provided, pangolin will attempt to auto-update its database before running the pipeline. The used database is stored in this folder and may be useful for replication. Can be given aspango_databaseinput directory.
NB: The value of <VARIANT_CALLER> in the output directory name above is determined by the --variant_caller parameter (Default: ‘ivar’ for ‘—protocol amplicon’ and ‘bcftools’ for ‘—protocol metagenomic’).
NB: The value of <CONSENSUS_CALLER> in the output directory name above is determined by the --consensus_caller parameter (Default: ‘bcftools’ for both ‘—protocol amplicon’ and ‘—protocol metagenomic’).
Phylogenetic Assignment of Named Global Outbreak LINeages (Pangolin) has been used extensively during the COVID-19 pandemic in order to to assign lineages to SARS-CoV-2 genome sequenced samples. A web application also exists that allows users to upload genome sequences via a web browser to assign lineages to genome sequences of SARS-CoV-2, view descriptive characteristics of the assigned lineage(s), view the placement of the lineage in a phylogeny of global samples, and view the temporal and geographic distribution of the assigned lineage(s).
Nextclade
Output files
variants/<VARIANT_CALLER>/consensus/<CONSENSUS_CALLER>/nextclade/*.csv: Analysis results from Nextlade containing genome clade assignment, mutation calling and sequence quality checks.
NB: The value of <VARIANT_CALLER> in the output directory name above is determined by the --variant_caller parameter (Default: ‘ivar’ for ‘—protocol amplicon’ and ‘bcftools’ for ‘—protocol metagenomic’).
NB: The value of <CONSENSUS_CALLER> in the output directory name above is determined by the --consensus_caller parameter (Default: ‘bcftools’ for both ‘—protocol amplicon’ and ‘—protocol metagenomic’).
Nextclade performs viral genome clade assignment, mutation calling and sequence quality checks for the consensus sequences generated in this pipeline. Similar to Pangolin, it has been used extensively during the COVID-19 pandemic. A web application also exists that allows users to upload genome sequences via a web browser.
Variants long table
Output files
variants/<VARIANT_CALLER>/variants_long_table.csv: Long format table collating per-sample information for individual variants, functional effect prediction and lineage analysis.additional_variants_long_table.csv: Long format table similar tovariants_long_table.csvfor additional annotation file with overlapping annotation features.
NB: The value of <VARIANT_CALLER> in the output directory name above is determined by the --variant_caller parameter (Default: ‘ivar’ for ‘—protocol amplicon’ and ‘bcftools’ for ‘—protocol metagenomic’).
Create variants long format table collating per-sample information for individual variants (BCFTools), functional effect prediction (SnpSift) and lineage analysis (Pangolin). The variants used for this table are the ones passing variant caller filters (variants/<VARIANT_CALLER>/*.vcf.gz):
- For ivar by default filters are:
- Allele frequency threshold >= 0.25
- Minimum quality score threshold = 20
- Minimum position depth = 10
- If using metagenomics protocol, strand bias filter also is aplied in
ivar_variants_to_vcf.py
- For bcftools default filters are:
- Minimum quality score threshold = 20
- Minimum position depth = 10
To filter variants included in the consensus genome from the variants long table file, the following filters should be applied:
- AF >= 0.75
Additionally, to filter variants included in the consensus genome that are missense variants from the variants long table file, the following filters should be applied:
- AF >= 0.75
- EFFECT == missense_variant
The more pertinent variant information is summarised in this table to make it easier for researchers to assess the impact of variants found amongst the sequenced sample(s). An example of the fields included in the table are shown below:
SAMPLE,CHROM,POS,REF,ALT,FILTER,DP,REF_DP,ALT_DP,AF,GENE,EFFECT,HGVS_C,HGVS_P,HGVS_P_1LETTER,CALLER,LINEAGE
SAMPLE1_PE,MN908947.3,241,C,T,PASS,489,4,483,0.99,orf1ab,upstream_gene_variant,c.-25C>T,.,.,ivar,B.1
SAMPLE1_PE,MN908947.3,1875,C,T,PASS,92,62,29,0.32,orf1ab,missense_variant,c.1610C>T,p.Ala537Val,p.A537V,ivar,B.1
SAMPLE1_PE,MN908947.3,3037,C,T,PASS,213,0,213,1.0,orf1ab,synonymous_variant,c.2772C>T,p.Phe924Phe,p.F924F,ivar,B.1
SAMPLE1_PE,MN908947.3,11719,G,A,PASS,195,9,186,0.95,orf1ab,synonymous_variant,c.11454G>A,p.Gln3818Gln,p.Q3818Q,ivar,B.1
Table columns:
- SAMPLE: sample name
- CHROM: Reference/fragment ID
- POS: Position of the variant respect to the reference genome
- REF: Reference allele
- ALT: Alternative allele
- FILTER: Column indicating if the variant passed the filters. If PASS the variant passed all the filters. If not, the name of the filter that wasn’t passed will appear.
- DP: Position read depth
- REF_DP: Reference allele depth
- ALT_DP: Alternative allele depth
- AF: Alternative allele frequency
- GENE: Gene name in annotation file
- EFFECT: Effect of the variant
- HGVS_C: Position annotation at CDS level
- HGVS_P: Position annotation at protein level
- HGVS_P_1LETTER: Position annotation at protein level with the aminoacid annotation in 1 letter format
- Caller: Variant caller used
Illumina: De novo assembly
A file called summary_assembly_metrics_mqc.csv containing a selection of read alignment and de novo assembly related metrics will be saved in the multiqc/ results directory. The same metrics will also be added to the top of the MultiQC report.
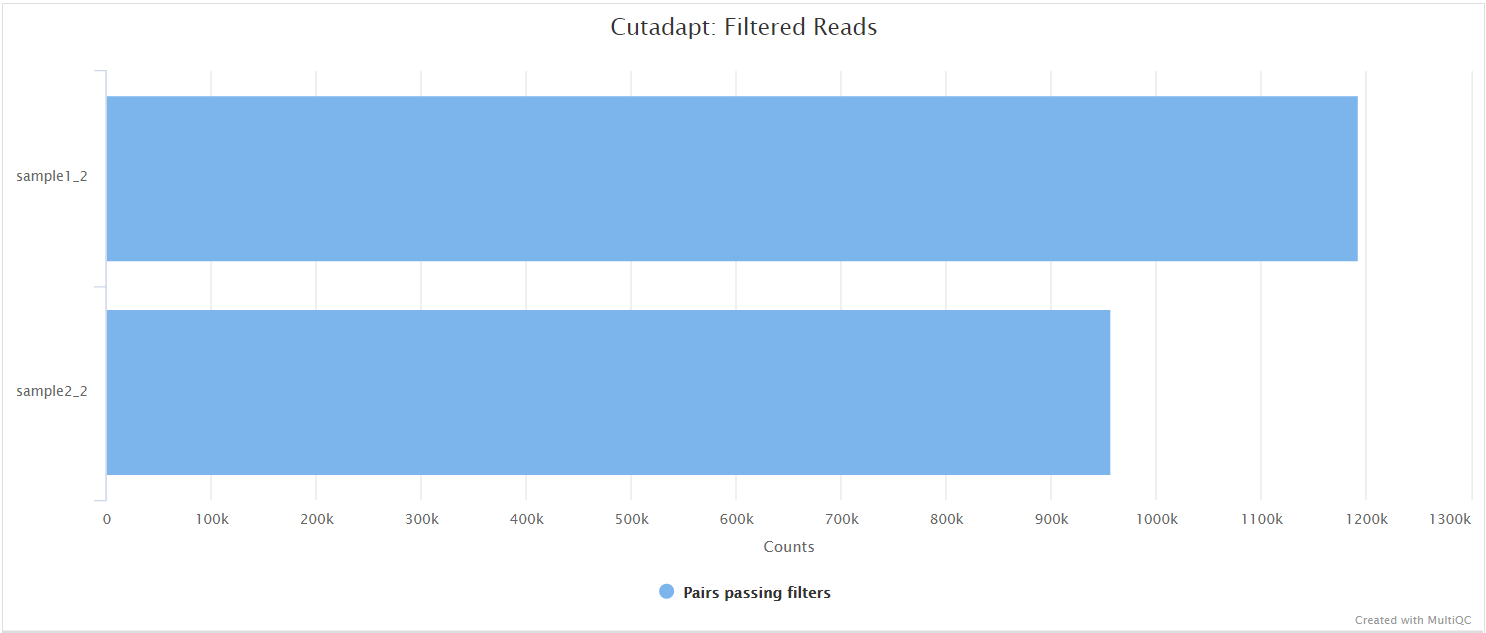
Cutadapt
Output files
assembly/cutadapt/log/*.cutadapt.log: Cutadapt log file generated from stdout.
assembly/cutadapt/fastqc/*_fastqc.html: FastQC report of the trimmed reads.*_fastqc.zip: Zip archive containing the FastQC report.
In the variant calling branch of the pipeline we are using iVar trim to remove primer sequences from the aligned BAM files for amplicon data. Since in the de novo assembly branch we don’t align the reads, we use Cutadapt as an alternative option to remove and clean the primer sequences directly from FastQ files.
SPAdes
Output files
assembly/spades/<SPADES_MODE>/*.scaffolds.fa.gz: SPAdes scaffold assembly.*.contigs.fa.gz: SPAdes assembly contigs.*.assembly.gfa.gz: SPAdes assembly graph in GFA format.
assembly/spades/<SPADES_MODE>/bandage/*.png: Bandage visualisation for SPAdes assembly graph in PNG format.*.svg: Bandage visualisation for SPAdes assembly graph in SVG format.
NB: The value of <SPADES_MODE> in the output directory name above is determined by the --spades_mode parameter (Default: ‘rnaviral’).
SPAdes is an assembly toolkit containing various assembly pipelines. Generically speaking, SPAdes is one of the most popular de Bruijn graph-based assembly algorithms used for bacterial/viral genome reconstruction.
Bandage is a program for visualising de novo assembly graphs. By displaying connections which are not present in the contigs file, Bandage opens up new possibilities for analysing de novo assemblies.
Unicycler
Output files
assembly/unicycler/*.scaffolds.fa.gz: Unicycler scaffold assembly.*.assembly.gfa.gz: Unicycler assembly graph in GFA format.
assembly/unicycler/bandage/*.png: Bandage visualisation for Unicycler assembly graph in PNG format.*.svg: Bandage visualisation for Unicycler assembly graph in SVG format.
Unicycler is an assembly pipeline for bacterial genomes. It can assemble Illumina-only read sets where it functions as a SPAdes-optimiser.
minia
Output files
assembly/minia/*.contigs.fa: Minia scaffold assembly.*.unitigs.fa: Minia unitigs fasta file.*.h5: Minia h5 output file.
Minia is a short-read assembler based on a de Bruijn graph, capable of assembling a human genome on a desktop computer in a day. The output of Minia is a set of contigs. Minia produces results of similar contiguity and accuracy to other de Bruijn assemblers.
BLAST
Output files
assembly/<ASSEMBLER>/blastn/*results.blastn.txt: BLAST results against the target virus.*.filter.blastn.txt: Filtered BLAST results.- Applied filters by default are:
qlen(contig length) > 200 nt%cgAligned(percentage of contig aligned) > 0.7 (70%)
- Columns description (for more information see: https://www.metagenomics.wiki/tools/blast/blastn-output-format-6):
- stitle: Subject Title. Name of the reference genome.
- staxids: Subject Taxonomy ID(s), separated by a ’;’. When blast databse is no annotated with taxids, 0 will appear.
- qaccver: Query accesion version. Contig name.
- saccver: Subject accession version. Reference genome accession version.
- pident: Percentage of identical matches.
- length: Alignment length.
- mismatch: Number of mismatches.
- gapopen: Number of gap openings.
- qstart: Start of alignment in query (sample’s contig).
- qend: End of alignment in query (sample’s contig).
- sstart: Start of alignment in subject (reference genome).
- send: Start of alignment in subject (reference genome).
- evalue: Expect value.
- bitscore: Bit score. The bit-score is the requires size of a sequence database in which the current match could be found just by chance. The bit-score is a log2 scaled and normalized raw-score. Each increase by one doubles the required database size (2bit-score).
- slen: Subject (reference genome) sequence length.
- qlen: Query (contig) sequence length.
- qcovs: Query Coverage Per Subject.
- %cgAligned: Percentage of contig covered in the alignment. It is calculated dividing
length/qlen. - %refCovered: Percentage of reference genome covered in the alignment. It is calculated dividing
length/slen.
- Applied filters by default are:
NB: The value of <ASSEMBLER> in the output directory name above is determined by the --assemblers parameter (Default: ‘spades’).
blastn is used to align the assembled contigs against the virus reference genome.
ABACAS
Output files
assembly/<ASSEMBLER>/abacas/*.abacas.bin: Bin file that contains contigs that are not used in ordering.*.abacas.crunch: Comparison file.*.abacas.fasta: Ordered and orientated sequence file.*.abacas.gaps: Gap information.*.abacas.gaps.tab: Gap information in tab-delimited format.*.abacas.MULTIFASTA.fa: A list of ordered and orientated contigs in a multi-fasta format.*.abacas.tab: Feature file*.unused_contigs.out: Information on contigs that have a mapping information but could not be used in the ordering.
assembly/<ASSEMBLER>/abacas/nucmer/: Folder containing the files generated by the NUCmer algorithm used by ABACAS.
NB: The value of <ASSEMBLER> in the output directory name above is determined by the --assemblers parameter (Default: ‘spades’).
ABACAS was developed to rapidly contiguate (align, order, orientate), visualize and design primers to close gaps on shotgun assembled contigs based on a reference sequence.
PlasmidID
Output files
assembly/<ASSEMBLER>/plasmidid/<SAMPLE>/*_final_results.html: Summary file with reference coverage stats and contigs for visualization.*_final_results.tab: Summary file with reference coverage stats and contigs.images/<SAMPLE>_<REF_NAME>.png: PNG file with the visualization of the alignment between the viral assembly and the reference viral genome.logs/: Log files.
NB: The value of <ASSEMBLER> in the output directory name above is determined by the --assemblers parameter (Default: ‘spades’).
PlasmidID was used to graphically represent the alignment of the reference genome relative to a given assembly. This helps to visualize the coverage of the reference genome in the assembly. To find more information about the output files refer to the documentation.
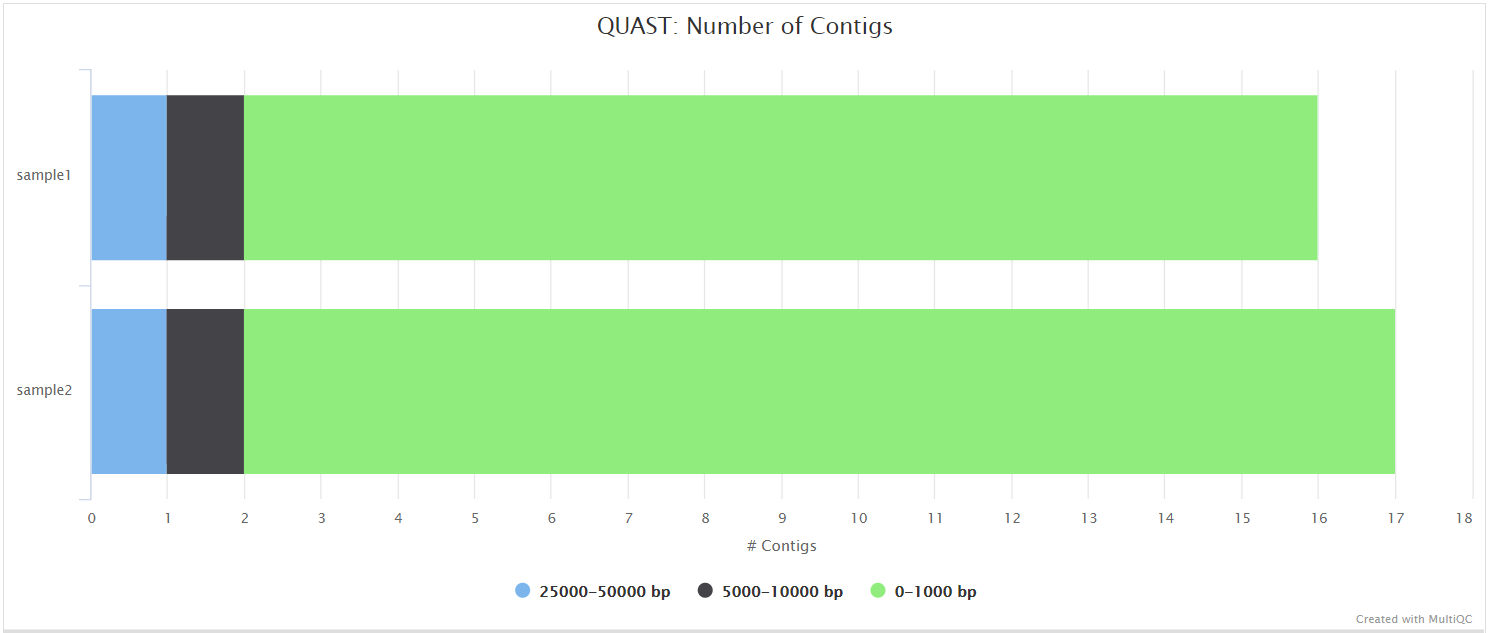
Assembly QUAST
Output files
assembly/<ASSEMBLER>/quast.<ASSEMBLER>/report.html: Results report in HTML format. Also available in various other file formats i.e.report.pdf,report.tex,report.tsvandreport.txt.
NB: The value of <ASSEMBLER> in the output directory name above is determined by the --assemblers parameter (Default: ‘spades’).
QUAST is used to generate a single report with which to evaluate the quality of the de novo assemblies across all of the samples provided to the pipeline. The HTML results can be opened within any browser (we recommend using Google Chrome). Please see the QUAST output docs for more detailed information regarding the output files.
Illumina: Workflow reporting and genomes
MultiQC
Output files
multiqc/multiqc_report.html: a standalone HTML file that can be viewed in your web browser.multiqc_data/: directory containing parsed statistics from the different tools used in the pipeline.summary_variants_metrics_mqc.csv: file containing a selection of read alignment and variant calling metrics. The same metrics will also be added to the top of the MultiQC report.summary_assembly_metrics_mqc.csv: file containing a selection of read alignment and de novo assembly related metrics. The same metrics will also be added to the top of the MultiQC report.
MultiQC is a visualization tool that generates a single HTML report summarising all samples in your project. Most of the pipeline QC results are visualised in the report and further statistics are available in the report data directory.
Results generated by MultiQC collate pipeline QC from supported tools e.g. FastQC. The pipeline has special steps which also allow the software versions to be reported in the MultiQC output for future traceability. For more information about how to use MultiQC reports, see http://multiqc.info.
The default multiqc config file has been written in a way in which to structure these QC metrics to make them more interpretable in the final report.
The pipeline has special steps which also allow the software versions to be reported in the MultiQC output for future traceability. For more information about how to use MultiQC reports, see http://multiqc.info.
An example MultiQC report generated from a full-sized dataset can be viewed on the nf-core website.
Reference genome files
Output files
genome/bowtie2/: Bowtie 2 index for viral genome.blast_db/: BLAST database for viral genome.kraken2_db/: Kraken 2 database for host genome.snpeff_db/: SnpEff database for viral genome.snpeff.config: SnpEff config file for viral genome.- Unzipped genome fasta file for viral genome
- Unzipped genome annotation GFF file for viral genome
A number of genome-specific files are generated by the pipeline because they are required for the downstream processing of the results. If the --save_reference parameter is provided then the Bowtie 2 alignment indices, BLAST and Kraken 2 databases downloaded/generated by the pipeline will be saved in the genome/ directory. It is recommended to use the --save_reference parameter if you are using the pipeline to build a Kraken 2 database for the host genome. This can be quite a time-consuming process and it permits their reuse for future runs of the pipeline or for other purposes.
Pipeline information
Output files
pipeline_info/- Reports generated by Nextflow:
execution_report.html,execution_timeline.html,execution_trace.txtandpipeline_dag.dot/pipeline_dag.svg. - Reports generated by the pipeline:
pipeline_report.html,pipeline_report.txtandsoftware_versions.yml. Thepipeline_report*files will only be present if the--email/--email_on_failparameter’s are used when running the pipeline. - Reformatted samplesheet files used as input to the pipeline:
samplesheet.valid.csv. - Parameters used by the pipeline run:
params.json.
- Reports generated by Nextflow:
Nextflow provides excellent functionality for generating various reports relevant to the running and execution of the pipeline. This will allow you to troubleshoot errors with the running of the pipeline, and also provide you with other information such as launch commands, run times and resource usage.