nf-core/denovotranscript
A pipeline for de novo transcriptome assembly of paired-end short reads from bulk RNA-seq
1.0.0). The latest
stable release is
1.2.1
.
Introduction
This document describes the output produced by the pipeline. Most of the plots are taken from the MultiQC report generated from the full test dataset for the pipeline using a command similar to the one below:
nextflow run nf-core/denovotranscript \
  -profile test_full,singularity \
  --outdir <OUTDIR> \
  --extra_fastp_args='--trim_front1 15 --trim_front2 15' \
  --remove_ribo_rna \
  --save_non_ribo_reads \
  --busco_lineage= 'arthropoda_odb10'
The directories listed below will be created in the results directory after the pipeline has finished. All paths are relative to the top-level results directory.
Pipeline overview
The pipeline is built using Nextflow and processes data using the following steps:
- Pre-processing
- Transcriptome assembly
- Redundancy reduction
- EvidentialGene - Redundancy reduction with tr2aacds
- tx2gene - Create a transcript to gene mapping file
- Assembly quality assessment
- Quantification
- Salmon - Pseudo-alignment and quantification (transcript-level)
- MultiQC - Aggregate report describing results and QC from the whole pipeline
- Pipeline information - Report metrics generated during the workflow execution
Pre-processing
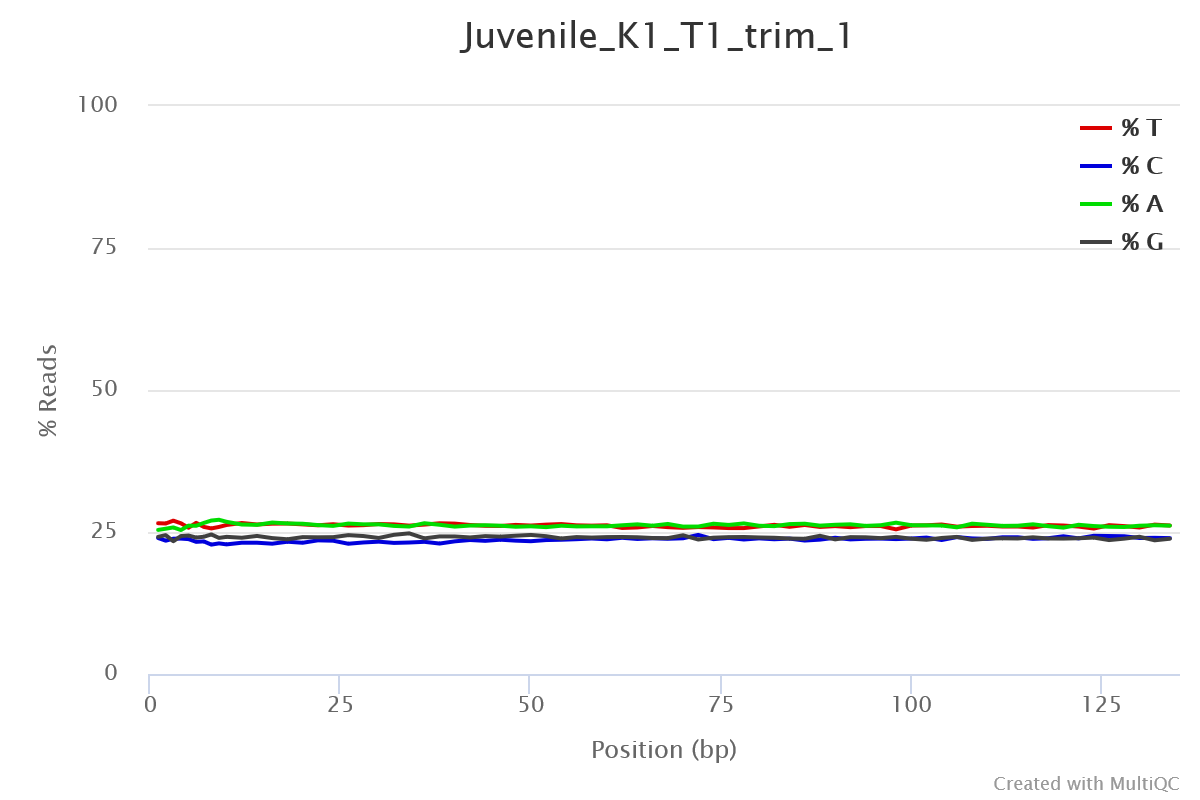
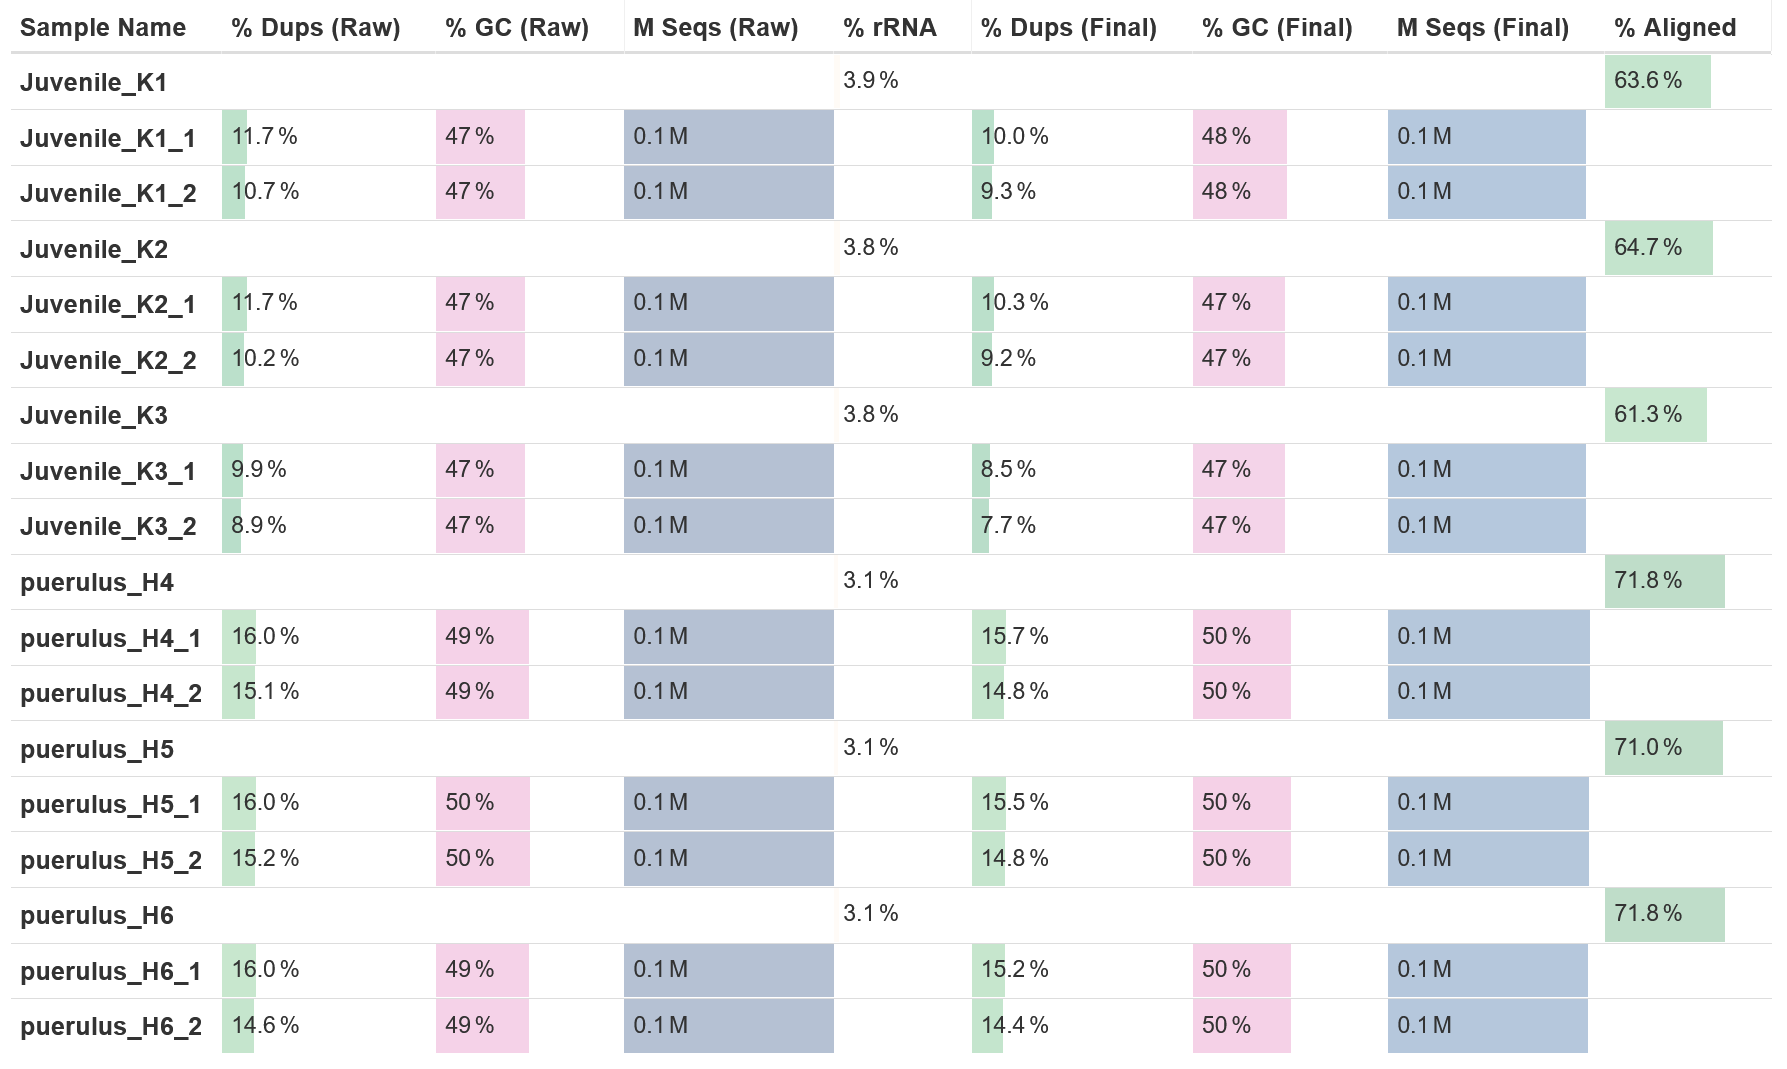
FastQC
Output files
fastqc/raw: For raw reads*_fastqc.html: FastQC report containing quality metrics.*_fastqc.zip: Zip archive containing the FastQC report, tab-delimited data file and plot images.
fastqc/trim: For reads after trimming with fastp*_fastqc.html: FastQC report containing quality metrics.*_fastqc.zip: Zip archive containing the FastQC report, tab-delimited data file and plot images.
fastqc/final: For reads after filtering out rRNA with SortMeRNA*_fastqc.html: FastQC report containing quality metrics.*_fastqc.zip: Zip archive containing the FastQC report, tab-delimited data file and plot images.
FastQC gives general quality metrics about your sequenced reads. It provides information about the quality score distribution across your reads, per base sequence content (%A/T/G/C), adapter contamination and overrepresented sequences. For further reading and documentation see the FastQC help pages.
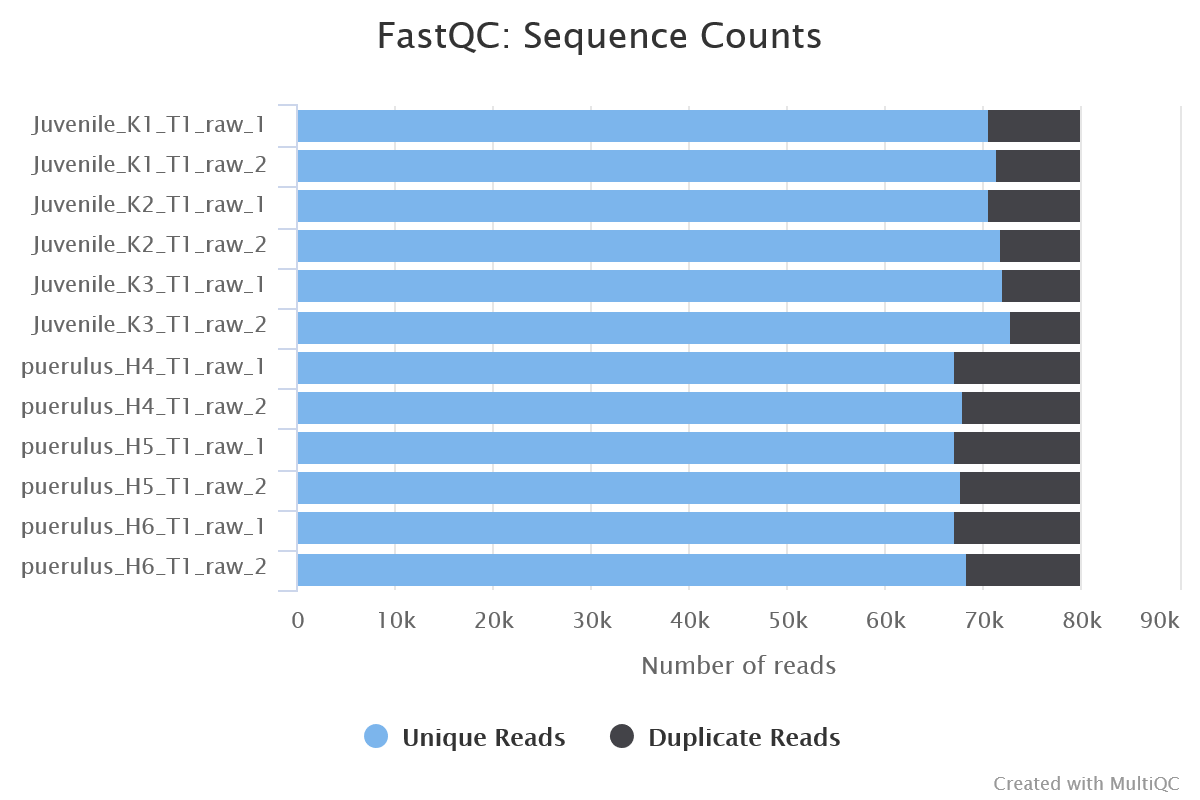
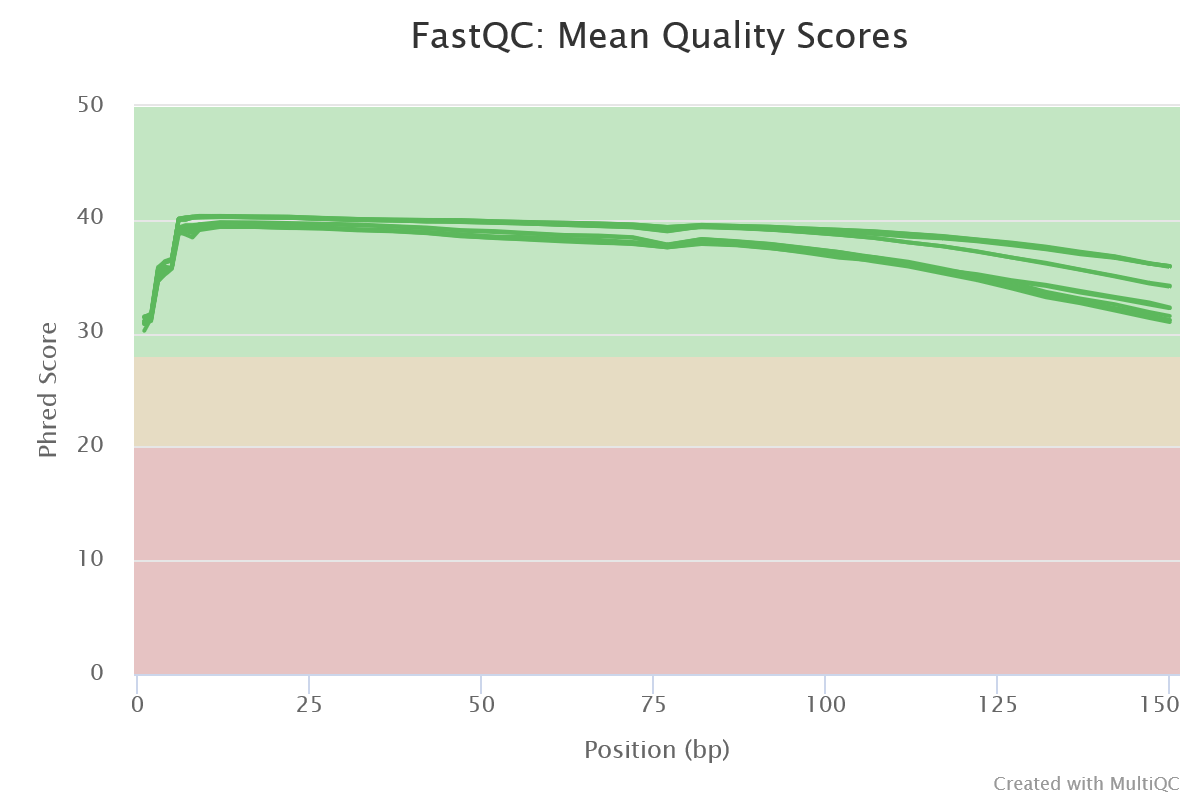
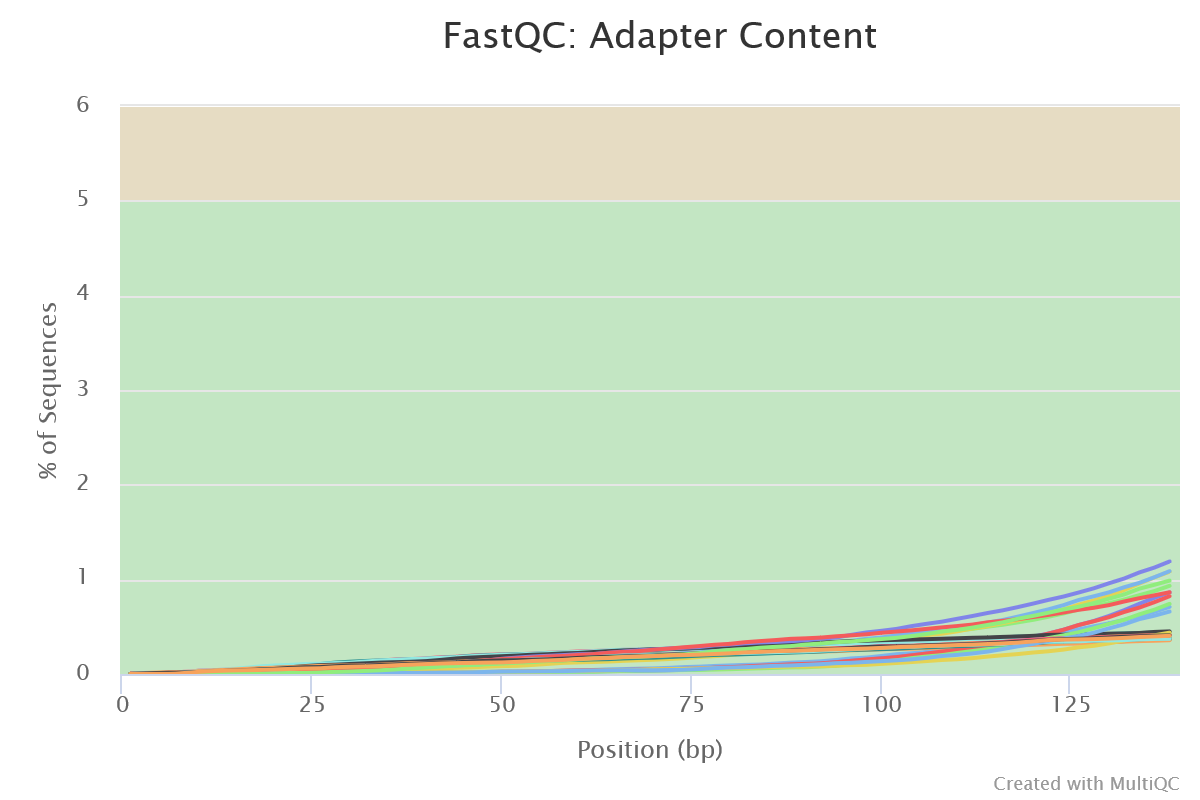
NB: The FastQC plots displayed in the MultiQC report shows untrimmed reads. They may contain adapter sequence and potentially regions with low quality.
fastp
Output files
fastp/*fastp.fastq.gz: FastQ files of reads after trimming will be placed in this directory.*.fastp.html: Trimming report in html format.*.fastp.json: Trimming report in json format.*.fastp.log: Trimming log file.*.fail.fastq.gz: FastQ files of reads that failed trimming will be placed in this directory if the--save_trimmed_failparameter is used.
fastp is a tool designed to provide fast, all-in-one preprocessing for FastQ files. It has been developed in C++ with multithreading support to achieve higher performance. fastp is used in this pipeline for standard adapter trimming and quality filtering. You can specify additional options for fastp via the --extra_fastp_args parameter.
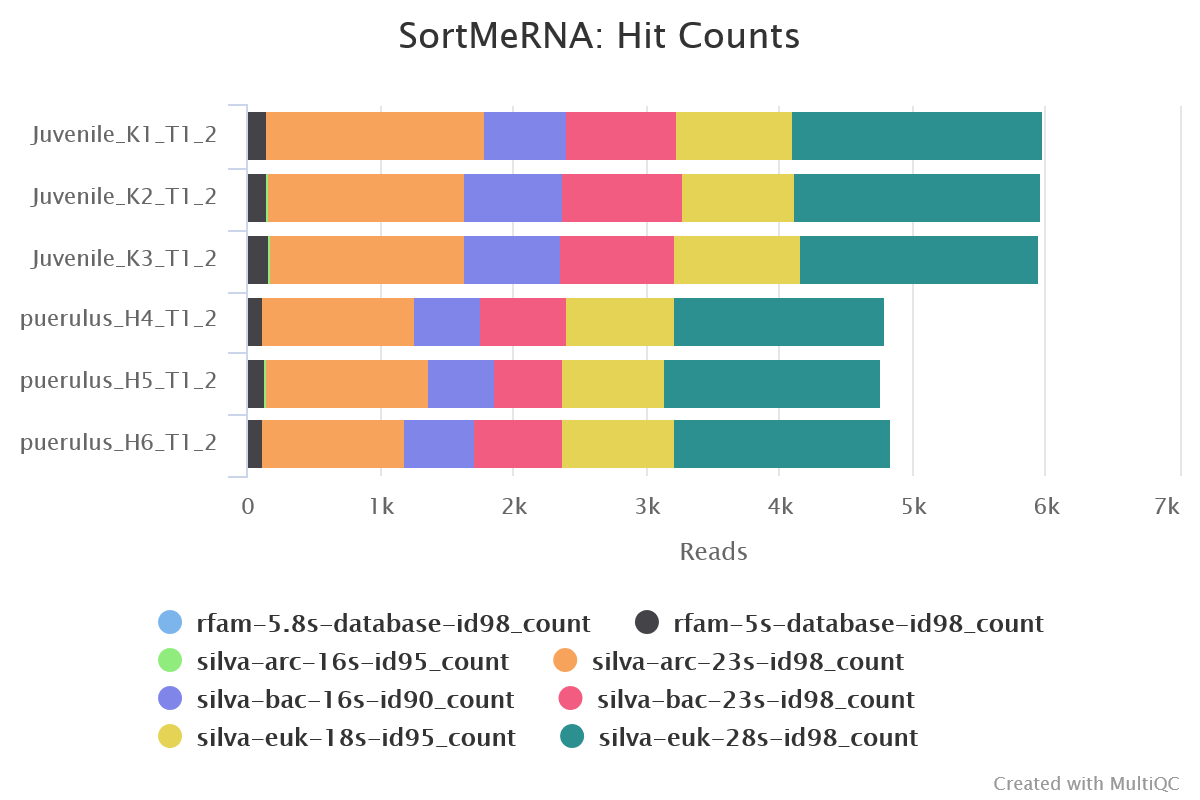
SortMeRNA
Output files
sortmerna/*.fastq.gz: If--save_non_ribo_readsis specified, FastQ files containing non-rRNA reads will be placed in this directory.*.log: Log file generated by SortMeRNA with information regarding reads that matched the reference database(s).
When --remove_ribo_rna is specified, the pipeline uses SortMeRNA for the removal of ribosomal RNA. By default, rRNA databases defined in the SortMeRNA GitHub repo are used. You can see an example in the pipeline Github repository in assets/rrna-default-dbs.txt which is used by default via the --ribo_database_manifest parameter. Please note that commercial/non-academic entities require licensing for SILVA for these default databases.
Transcriptome assembly
Cat
Output files
cat/pooled.merged.fastq.gz: FastQ files after reads have been concatenated will be placed in this directory.all_assembled.fa.gz: Transcripts from all assemblies concatenated into one file, before redundancy reduction.
The pipeline pools together pre-processed reads from all samples into one file for forward and one file for reverse reads. De novo transcriptome assemblies are created using these pooled reads.
Trinity
Output files
trinity/*.fa.gz: de novo assembled transcripts fasta file compressed. This is produced if"trinity"and/or"trinity_no_norm"is included in theassemblersparameter.pooled_reads.log: Log file from trinity.
Trinity is used for efficient and robust de novo reconstruction of transcriptomes from RNA-seq data.
rnaSPAdes
Output files
rnaspades/*.assembly.gfa.gz: Assembly graph in GFA format.*.transcripts.fasta: Transcriptome assembly in FASTA format containing medium filtered transcripts. This is produced if the"rnaspades"assembler is used.*soft_filtered_transcripts.fa.gz: Transcriptome assembly in FASTA format containing soft filtered transcripts. This will only be used in the Evidential Gene step if"rnaspdes"assembler is used and the--soft_filtered_transcriptsparameter is true.*hard_filtered_transcripts.fa.gz: Transcriptome assembly in FASTA format containing hard filtered transcripts. These will only be used in the Evidential Gene step if"rnaspades"assembler is used and the--soft_filtered_transcriptsparameter is true.*spades.log: Log file from Spades.
rnaSPAdes is a tool that is primarily intended for assembling eukaryotic transcriptomes from short reads. However, it can also be utilized for assembling prokaryotic transcriptomes and meta-transcriptomes.
Redundancy reduction
EvidentialGene
Output files
evigene/dropset/: Directory containing dropped transcripts and associated files.okayset/: Directory containing included transcripts and associated files. The*.okay.mrnafile in this directory contains mrna sequences for non-redundant transcripts. This is the final transcriptome assemly. The*.okay.aafile contains protein sequences for non-redundant transcripts.
Evidential Gene’s tr2aacds tool reduces redundancy by selecting the longest coding sequence, whilst preserving alternate and paralog transcripts that have a significant amount of unique sequence. It categorizes transcripts as either ‘okay’ or ‘drop’, separating those that are useful from those that are not.
tx2gene
Output files
tx2gene/*tx2gene.tsv: A tab-delimited file containing the transcript to gene mapping. The first column contains the transcript ID and the second column contains the gene ID.
The tx2gene mapping is created based on the okayset/*.pubids file generated by EvidentialGene.
Assembly quality assessment
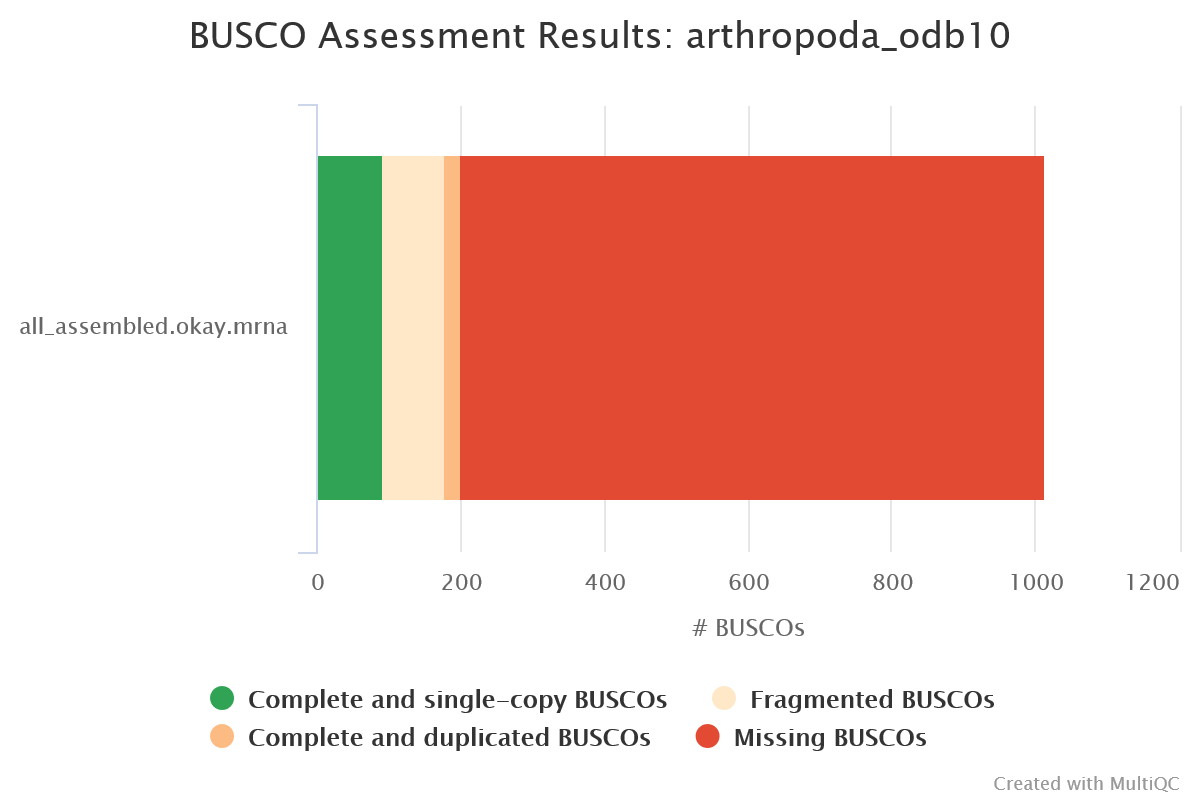
BUSCO
Output files
busco/*-busco/: Directory containing BUSCO lineage specific outputshort_summary*.json: Short Busco summary in plain text formatshort_summary*.txt: Short Busco summary in JSON format*batch_summary.txt: Shorter summary of all sequence files analyzed
BUSCO is a tool that assesses the completeness of genome assemblies, gene sets, and transcriptomes in terms of expected gene content. It uses lineage-specific sets of Benchmarking Universal Single-Copy Orthologs (BUSCOs) to provide quantitative measures of assembly quality.
rnaQUAST
Output files
rnaquast/*_output/: Directory containing detailed metrics (see example below)logs: Directory containing log filesshort_report.pdf: Summary report in PDF formatshort_report.tex: Summary report in LaTeX formatshort_report.txt: Summary report in plain text formatshort_report.tsv: Summary report in TSV format
rnaQUAST is a tool for evaluating the quality of transcriptome assemblies using a reference genome and gene database. It can also produce reference-free metrics such as N50 and the number of transcripts > 1000bp.
METRICS/TRANSCRIPTS                                    all_assembled.okay.mrna
== BASIC TRANSCRIPTS METRICS (calculated without reference genome and gene database) ==
Transcripts                                            7542

Transcripts > 500 bp                                   4161
Transcripts > 1000 bp                                  1581

Average length of assembled transcripts                853.485
Longest transcript                                     27171
Total length                                           6436985

Transcript N50                                         1084
TransRate
Output files
transrate/<assembly file basename>/: Directory containing detailed metrics and associated filesassemblies.csv: CSV file containing summary metrics for assemblytransrate.log: log file showing command output from TransRate
TransRate can analyse assembly quality using evidence from sequencing reads and provides quality scores for contigs and assemblies.
Read mapping metrics:
-----------------------------------
fragments                    440655
fragments mapped             305702
p fragments mapped             0.69
good mappings                285522
p good mapping                 0.65
bad mappings                  20180
potential bridges               168
bases uncovered              769015
p bases uncovered              0.12
contigs uncovbase              2840
p contigs uncovbase            0.38
contigs uncovered               743
p contigs uncovered             0.1
contigs lowcovered             6780
p contigs lowcovered            0.9
contigs segmented               183
p contigs segmented            0.02
Read metrics done in 54 seconds
No reference provided, skipping comparative diagnostics
TRANSRATE ASSEMBLY SCORE     0.3126
-----------------------------------
TRANSRATE OPTIMAL SCORE      0.4516
TRANSRATE OPTIMAL CUTOFF     0.0624
good contigs                   6897
p good contigs                 0.91
Quantification
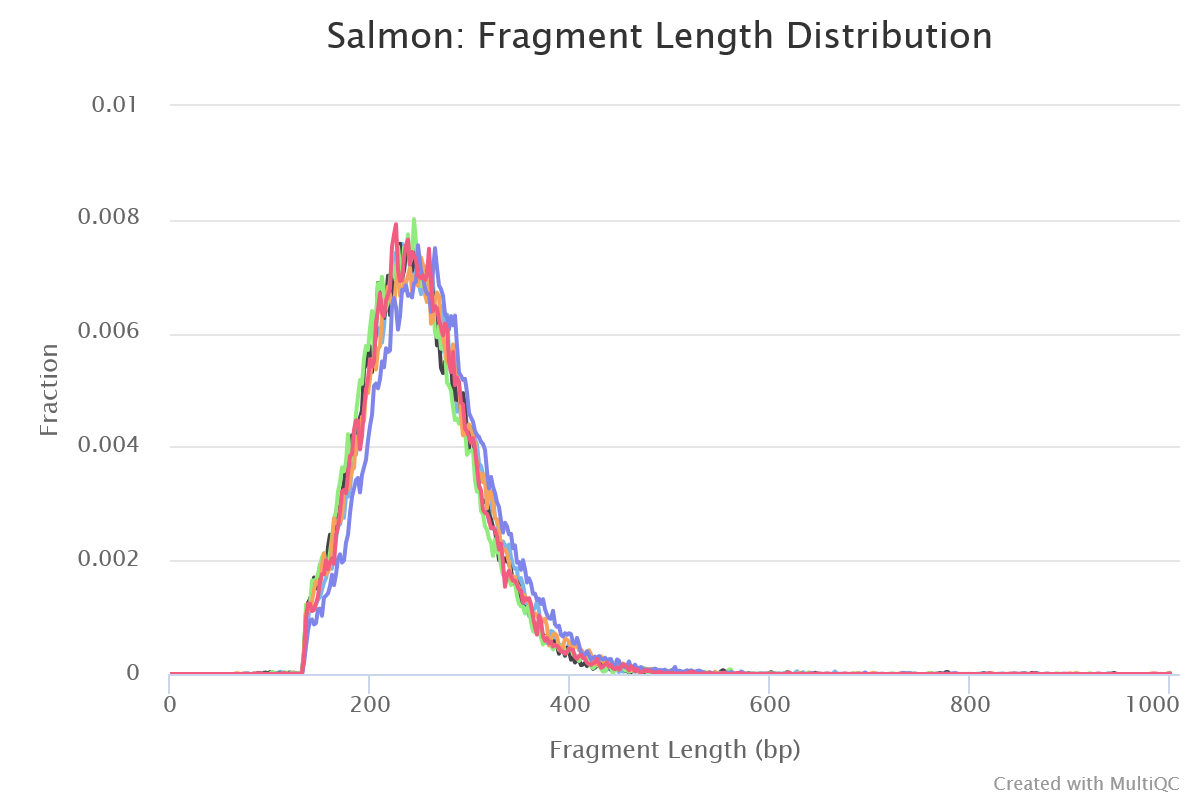
Salmon
Output files
salmon/<SAMPLE>/aux_info/: Auxiliary info e.g. versions and number of mapped reads.cmd_info.json: Information about the Salmon quantification command, version and options.lib_format_counts.json: Number of fragments assigned, unassigned and incompatible.libParams/: Contains the fileflenDist.txtfor the fragment length distribution.logs/: Contains the filesalmon_quant.loggiving a record of Salmon’s quantification.quant.sf: Salmon transcript-level quantification of the sample, including feature length, effective length, TPM, and number of reads.
*lib_format_counts.json: Contains information about the library format that was inferred.*meta_info.json: Meta information from Salmon quant such as version and options used.
Salmon is a tool for quantifying the expression of transcripts using RNA-seq data. It uses a quasi-mapping-based approach to provide fast and accurate quantification.
MultiQC
Output files
multiqc/multiqc_report.html: a standalone HTML file that can be viewed in your web browser.multiqc_data/: directory containing parsed statistics from the different tools used in the pipeline.multiqc_plots/: directory containing static images from the report in various formats.
MultiQC is a visualization tool that generates a single HTML report summarising all samples in your project. Most of the pipeline QC results are visualised in the report and further statistics are available in the report data directory.
Results generated by MultiQC collate pipeline QC from supported tools e.g. FastQC. The pipeline has special steps which also allow the software versions to be reported in the MultiQC output for future traceability. For more information about how to use MultiQC reports, see http://multiqc.info.
Pipeline information
Output files
pipeline_info/- Reports generated by Nextflow:
execution_report.html,execution_timeline.html,execution_trace.txtandpipeline_dag.dot/pipeline_dag.svg. - Reports generated by the pipeline:
pipeline_report.html,pipeline_report.txtandsoftware_versions.yml. Thepipeline_report*files will only be present if the--email/--email_on_failparameter’s are used when running the pipeline. - Reformatted samplesheet files used as input to the pipeline:
samplesheet.valid.csv. - Parameters used by the pipeline run:
params.json.
- Reports generated by Nextflow:
Nextflow provides excellent functionality for generating various reports relevant to the running and execution of the pipeline. This will allow you to troubleshoot errors with the running of the pipeline, and also provide you with other information such as launch commands, run times and resource usage.