nf-core/dualrnaseq
Analysis of Dual RNA-seq data - an experimental method for interrogating host-pathogen interactions through simultaneous RNA-seq.
22.10.6.Learn more.Output
Pipeline overview
The pipeline is built using Nextflow and processes data using the following steps:
FastQC
FastQC gives general quality metrics about your reads. It provides information about the quality score distribution across your reads and the per base sequence content (%T/A/G/C). Information about adapter contamination and other overrepresented sequences is also displayed.
Output directory for raw reads: results/fastqc
Output directory for trimmed reads: results/fastqc_after_trimming
Contents:
sample_fastqc.htmlandsample_trimmed_fastqc.html- FastQC reports,
sample_fastqc.htmlandsample_trimmed_fastqc.htmlcontain quality metrics for your untrimmed raw and trimmed fastq files, respectively.
- FastQC reports,
zips/sample_fastqc.zipandzips/sample_trimmed_fastqc.zip- zip file containing the FastQC report, tab-delimited data file and plot images
For further reading and documentation see the FastQC help.
Trimming reads
Two software options are provided to remove low quality reads and adapters: Cutadapt and BBDuk.
All samples are processed in the output directory and appended with _trimmed.fastq.gz
Output directory: results/trimming
Mapping/quantification
Depending on which mapping/quantification mode was selected, will depend on which folders and files appear here.
A) Salmon selective alignment
Output directory: results/salmon
Contents:
transcripts_index- All files produced by Salmon in the indexing phase.
- subfolders named as samples.
- All files and folders produced by Salmon in the quantification step of Selective Alignment mode. You can learn more about salmon outputs in
Salmon documentation. Each subfolder also contains separated quantification results from the host and pathogen stored inhost_quant.sfandpathogen_quant.sffiles, respectively.
- All files and folders produced by Salmon in the quantification step of Selective Alignment mode. You can learn more about salmon outputs in
combined_quant.tsv- Tab delimited file containing combined quantification results of all samples processed by the pipeline.
host_quant_salmon.tsvandpathogen_quant_salmon.tsv- Tab delimited files containing combined quantification results for either host or pathogen from all samples.
host_combined_quant_annotations.tsvandpathogen_combined_quant_annotations.tsv- Tab delimited files containing quantification results for either host or pathogen and annotations extracted from gff files including transcript_id, transcript_name, gene id, gene_name and gene_type.
host_combined_gene_level.tsv- Host gene-level estimates obtained using tximport.
host_combined_quant_gene_level_annotations.tsv- Tab delimited file containing host gene-level estimates and annotations extracted from gff files including gene id, gene_name and gene_type.
B) STAR + Salmon - alignment based
Output directory: results/STAR_for_salmon
Contents:
index- All files produced by STAR in the indexing phase.
- subfolders named as samples.
- Files produced by STAR in the alignment step. There are two bam files generated in this mapping mode: unsorted genome alignment
sampleAligned.out.bamandsampleAligned.sample_toTranscriptome.out.bamwhich contains alignments translated into transcript coordinates. SeeOutput in transcript coordinatesfrom theSTAR documentation.
- Files produced by STAR in the alignment step. There are two bam files generated in this mapping mode: unsorted genome alignment
Output directory: results/salmon_alignment_mode
Contents:
- subfolders named as samples
- All files and folders produced by Salmon in the quantification step of Selective Alignment mode. You can learn more about salmon outputs in
Salmon documentation. Each subfolder also contains separated quantification results from the host and pathogen stored inhost_quant.sfandpathogen_quant.sffiles, respectively.
- All files and folders produced by Salmon in the quantification step of Selective Alignment mode. You can learn more about salmon outputs in
combined_quant.tsv- Tab delimited file containing combined quantification results of all samples processed by the pipeline.
host_quant_salmon.tsvandpathogen_quant_salmon.tsv- Tab delimited files containing combined quantification results for either host or pathogen from all samples.
host_combined_quant_annotations.tsvandpathogen_combined_quant_annotations.tsv- Tab delimited files containing quantification results for either host or pathogen and annotations extracted from gff files including transcript_id, transcript_name, gene id, gene_name and gene_type.
host_combined_gene_level.tsv- Host gene-level estimates obtained using tximport.
host_combined_quant_gene_level_annotations.tsv- Tab delimited file containing host gene-level estimates and annotations extracted from gff file including gene id, gene_name and gene_type.
C) STAR + HTSeq
Output directory: results/STAR
Contents:
index- All files produced by STAR in the indexing phase.
- subfolders named as samples.
- All files produced by STAR in the alignment step.
sampleAligned.sortedByCoord.out.bamcontains genome alignment sorted by coordinates.
- All files produced by STAR in the alignment step.
multimapped_reads- This folder contains both
sample_cross_mapped_reads.txtfile with a list of cross-mapped reads between host and pathogen andsample_no_crossmapped.bamfiles with alignment without cross-mapped reads.
- This folder contains both
Output directory: results/HTSeq
Contents:
sample_count_u_m.txt- Quantification results for a sample.
quantification_results_uniquely_mapped.tsv- Tab delimited file containing combined quantification results of all samples processed by the pipeline.
quantification_results_uniquely_mapped_NumReads_TPM.tsv- Tab delimited file containing HTSeq quantification results and TPM values estimated for each gene in each sample. To calculate TPM values, the length of genes is calculated using gff annotation.
quantification_stats_uniquely_mapped.tsv- Statistics extracted from HTSeq quantification results.
host_quantification_uniquely_mapped_htseq.tsvandpathogen_quantification_uniquely_mapped_htseq.tsv- Tab delimited files containing combined quantification results for either host or pathogen from all samples.
host_combined_quant_annotations.tsvandpathogen_combined_quant_annotations.tsv- Tab delimited files containing quantification results for either host or pathogen and annotations extracted from gff files including gene_id, gene_name, gene_type and gene length.
References
The pipeline creates chimeric references of the pathogen and host, and here you can find references used for the mapping, quantification and collecting statistics.
Contents:
Salmon Selective Alignment references
host_pathogen.fasta:- Chimeric genome fasta file used as a decoy sequence in Salmon with Selective Alignment. You can find more information about the Selective Alignment algorithm in salmon documentation.
decoys.txt- List of decoy sequences generated by Salmon
*_parent_attribute.gff3:- Host or pathogen gff file containing ‘parent’ insted of gene attribute defined by
--gene_attribute_gff_to_create_transcriptome_hostor--gene_attribute_gff_to_create_transcriptome_pathogen, respectively. These files are used to extract annotations for each transcript.
- Host or pathogen gff file containing ‘parent’ insted of gene attribute defined by
*_transcriptome.fasta- Either host or pathogen transcriptome fasta file created by the pipeline.
host_pathogen_transcriptome.fasta- Merged host and pathogen transcriptomes.
gentrome.fasta- Merged decoy sequences and transcriptome. File is generated by Salmon.
host_gff_annotations_annotations_salmon.tsvandpathogen_gff_annotations_parent_salmon.tsv- Annotations extracted from gff files for host or pathogen transcripts, respectively.
*_parent_attribute_quant_feature_salmon_alignment.gff3- Host gff file containing ‘parent’ in place of genome attribute defined with
--gene_attribute_gff_to_create_transcriptome_hostandquantreplacing gene features defined by--gene_feature_gff_to_create_transcriptome_host. The file is used to extract annotations for each transcript.
- Host gff file containing ‘parent’ in place of genome attribute defined with
Salmon Alignment-based mode references
host_pathogen.fasta:- Chimeric genome fasta file used for read alignment with STAR.
*_parent_attribute.gff3:- Host or pathogen gff file containing ‘parent’ insted of gene attribute defined by
--gene_attribute_gff_to_create_transcriptome_hostor--gene_attribute_gff_to_create_transcriptome_pathogen, respectively. These files are used to extract annotations for each transcript.
- Host or pathogen gff file containing ‘parent’ insted of gene attribute defined by
*_transcriptome.fasta- Either host or pathogen transcriptome fasta file created by the pipeline.
host_pathogen_transcriptome.fasta- Merged host and pathogen transcriptomes.
host_gff_annotations_annotations_salmon.tsvandpathogen_gff_annotations_parent_salmon.tsv- Annotations extracted from gff files for host or pathogen transcripts, respectively.
*_parent_attribute_quant_feature_salmon_alignment.gff3- Host gff file containing ‘parent’ in place of genome attribute defined with
--gene_attribute_gff_to_create_transcriptome_hostandquantreplacing gene features defined by--gene_feature_gff_to_create_transcriptome_host. The file is used to extract annotations for each transcript.
- Host gff file containing ‘parent’ in place of genome attribute defined with
reference_host_names.txtandreference_pathogen_names.txt- List of either host or pathogen reference names defined in the 1st column of gff file. Files are used to identify uniquely mapped, cross-mapped and multi-mapped reads in alignments generated by Star.
STAR and HTSeq references
host_pathogen.fasta:- Chimeric genome fasta file used for read alignment.
*_quant_feature.gff3:- Either host or pathogen gff file containing
quantin place of gene features defined by--gene_feature_gff_to_quantify_hostor--gene_feature_gff_to_quantify_pathogen, respectively.
- Either host or pathogen gff file containing
*_quant_feature_new_attribute.gff3- Pathogen gff file containing
quantas gene feature and host gene attribute defined by--host_gff_atributein place of pathogen attribute specified with--pathogen_gff_atribute.
- Pathogen gff file containing
host_pathogen_htseq.gff- Chimeric gff file used for quantification.
*_htseq.tsv- Annotations extracted from gff files for host or pathogen genes.
reference_host_names.txtandreference_pathogen_names.txt- List of either host or pathogen reference names defined in the 1st column of gff file. Files are used to identify uniquely mapped, cross-mapped and multi-mapped reads in alignments generated by Star.
Mapping statistics
Depending on which mapping/quantification mode was selected, will depend on which folders and files appear here. In general, files and images within these folders show the number of reads, mapping statistics for both the host and pathogen, RNA-class statistics, as well as gene and transcript-based metrics.
Output directory: results/mapping_statistics
Contents:
STAR: results/mapping_statistics/STAR
-
star_mapping_stats.tsv- Tab delimited file containing mapping statistics collected from all samples.
-
mapping_stats_samples_total_reads.tsv- Set of mapping and quantification statistics extracted from
star_mapping_stats.tsvtable used to createmapping_stats_samples_total_reads.pdfplot.
- Set of mapping and quantification statistics extracted from
-
mapping_stats_samples_total_reads.pdf- Visualisation of mapping statistics from
mapping_stats_samples_total_reads.tsvtable.
- Visualisation of mapping statistics from
-
mapping_stats_samples_percentage.tsv- Mapping statistics from
mapping_stats_samples_total_reads.tsvtable expressed in percentage.
- Mapping statistics from
-
mapping_stats_samples_percentage.pdf- Visualisation of mapping statistics from
mapping_stats_samples_percentage.tsvtable.
- Visualisation of mapping statistics from
HTSeq: results/mapping_statistics/HTSeq
-
scatter_plots- Scatter plots showing correlations between TPM values of replicates within the same condition. The Pearson correlation coefficient is calculated using untransformed data.
-
htseq_uniquely_mapped_reads_stats.tsv- Collection of mapping and quantification statistics including number of reads uniquely and multi-mapped to either host or pathogen using STAR, number of cross-mapped reads, unmapped reads, trimmed reads and number of assigned reads to the pathogen and host by HTSeq.
-
mapping_stats_samples_total_reads.tsv- Set of mapping and quantification statistics extracted from
htseq_uniquely_mapped_reads_stats.tsvtable used to createmapping_stats_samples_total_reads.pdfplot.
- Set of mapping and quantification statistics extracted from
-
mapping_stats_samples_total_reads.pdf- Visualisation of mapping statistics from
mapping_stats_samples_total_reads.tsvtable.
- Visualisation of mapping statistics from
-
mapping_stats_samples_percentage.tsv- Mapping and quantification statistics from
mapping_stats_samples_total_reads.tsvtable expressed in percentage.
- Mapping and quantification statistics from
-
mapping_stats_samples_percentage.pdf- Visualisation of mapping statistics from
mapping_stats_samples_percentage.tsvtable.
- Visualisation of mapping statistics from
-
RNA_classes_pathogen-
pathogen_RNA_classes_sum_counts_htseq.tsv- Tab delimited file containing pathogen RNA class statistics for each sample. Sum of number of reads assigned to genes which belong to a specific RNA class.
-
pathogen_RNA_classes_percentage_htseq.tsv- Pathogen RNA class statistics from
pathogen_RNA_classes_sum_counts_htseq.tsvtable expressed in percentage.
- Pathogen RNA class statistics from
-
RNA_class_stats_combined_pathogen.pdf- Plot showing pathogen RNA class statistics for all samples from
pathogen_RNA_classes_percentage_htseq.tsvtable.
- Plot showing pathogen RNA class statistics for all samples from
-
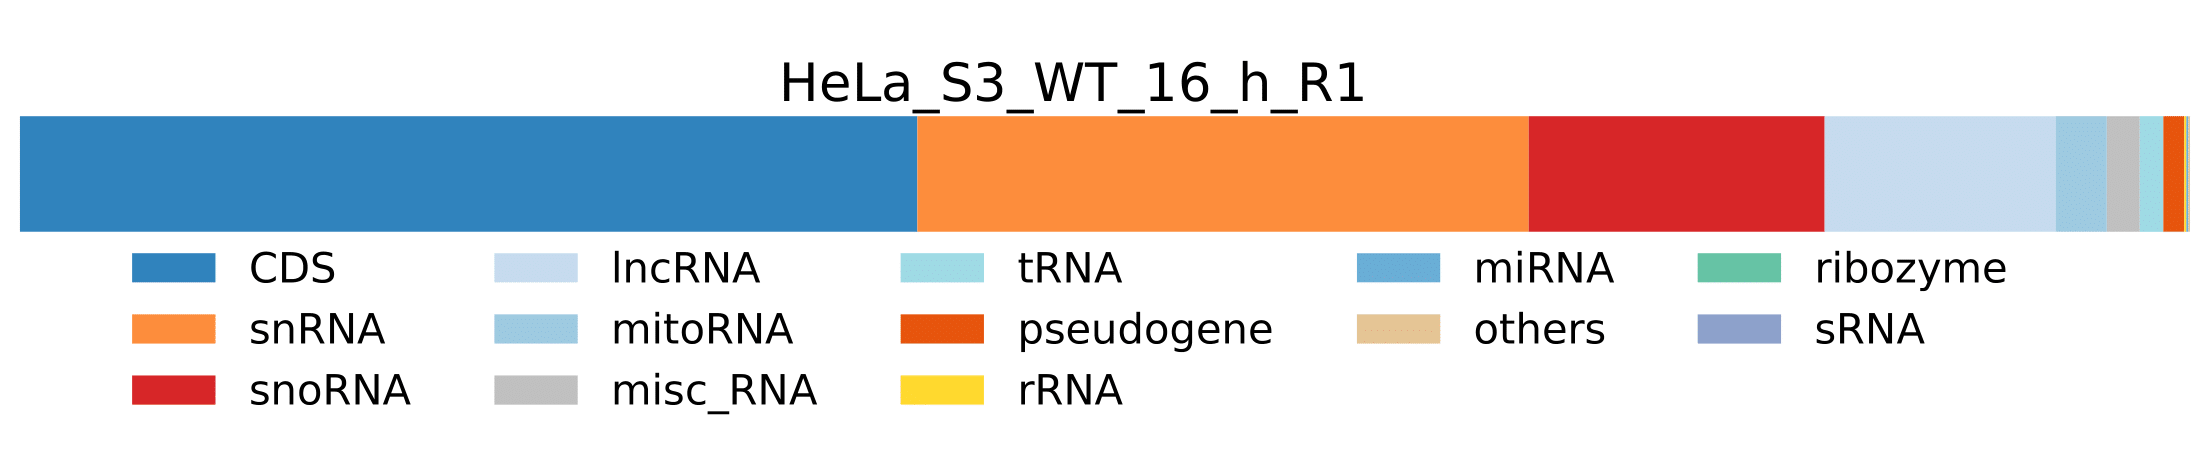
sample.pdf- Visualization of pathogen RNA classes statistics for a sample.
-
-
RNA_classes_host-
host_RNA_classes_sum_counts_htseq.tsv- Tab delimited file containing host RNA class statistics for each sample.
-
host_RNA_classes_percentage_htseq.tsv- Host RNA class statistics from
host_RNA_classes_sum_counts_htseq.tsvtable expressed in percentage.
- Host RNA class statistics from
-
host_gene_types_groups_gene.tsv- Tab delimited file containing list of host genes, including gene ids, gene names, counts obtained from quantification, and gene types assigned to each gene considering RNA class groups defined by
--RNA_classes_to_replace_host. For more information check parameters.md. This table is created only for examination of results.
- Tab delimited file containing list of host genes, including gene ids, gene names, counts obtained from quantification, and gene types assigned to each gene considering RNA class groups defined by
-
RNA_class_stats_combined_host.pdf- Visualization of host RNA class statistics for all samples from
host_RNA_classes_percentage_htseq.tsvtable.
- Visualization of host RNA class statistics for all samples from
-
sample.pdf- Visualization of host RNA classes statistics for a sample.
-
Salmon: results/mapping_statistics/salmon
-
scatter_plots- Scatter plots showing correlations between TPM values of replicates within the same condition. The Pearson correlation coefficient is calculated using untransformed data.
-
salmon_host_pathogen_total_reads.tsv- Tab delimited file containing mapping statistics collected from all samples.
-
mapping_stats_samples_total_reads.tsv- Set of mapping and quantification statistics extracted from
salmon_host_pathogen_total_reads.tsvtable used to createmapping_stats_samples_total_reads.pdfplot.
- Set of mapping and quantification statistics extracted from
-
mapping_stats_samples_total_reads.pdf- Visualisation of mapping statistics from
mapping_stats_samples_total_reads.tsvtable.
- Visualisation of mapping statistics from
-
mapping_stats_samples_percentage.tsv- Mapping statistics from
mapping_stats_samples_total_reads.tsvtable expressed in percentage.
- Mapping statistics from
-
mapping_stats_samples_percentage.pdf- Visualisation of mapping statistics from
mapping_stats_samples_percentage.tsvtable.
- Visualisation of mapping statistics from
-
RNA_classes_pathogen-
pathogen_RNA_classes_sum_counts_salmon.tsv- Tab delimited file containing pathogen RNA class statistics for each sample.
-
pathogen_RNA_classes_percentage_salmon.tsv- Pathogen RNA class statistics from
pathogen_RNA_classes_sum_counts_salmon.tsvtable expressed in percentage.
- Pathogen RNA class statistics from
-
RNA_class_stats_combined_pathogen.pdf- Plot showing pathogen RNA class statistics for all samples from
pathogen_RNA_classes_percentage_htseq.tsvtable.
- Plot showing pathogen RNA class statistics for all samples from
-
sample.pdf- Visualization of pathogen RNA classes statistics for a sample.
-
-
RNA_classes_host-
host_RNA_classes_sum_counts_salmon.tsv- Tab delimited file containing host RNA class statistics for each sample.
-
host_RNA_classes_percentage_salmon.tsv- Host RNA class statistics from
host_RNA_classes_sum_counts_salmonhead.tsvtable expressed in percentage.
- Host RNA class statistics from
-
host_gene_types_groups_transcript.tsv- Tab delimited file containing list of host transcripts, including transcript_id, transcript_name, gene ids, gene names, counts obtained from quantification, and gene types assigned to each gene considering RNA class groups defined by
--RNA_classes_to_replace_host. For more information check parameters.md. This table is created only for examination of results.
- Tab delimited file containing list of host transcripts, including transcript_id, transcript_name, gene ids, gene names, counts obtained from quantification, and gene types assigned to each gene considering RNA class groups defined by
-
RNA_class_stats_combined_host.pdf- Visualization of host RNA class statistics for all samples from
host_RNA_classes_percentage_salmon.tsvtable.
- Visualization of host RNA class statistics for all samples from
-
sample.pdf- Visualization of host RNA classes statistics for a sample.
-
Salmon alignment based: results/mapping_statistics/salmon_alignment_based
-
scatter_plots- Scatter plots showing correlations between TPM values of replicates within the same condition. The Pearson correlation coefficient is calculated using untransformed data.
-
salmon_alignment_host_pathogen_total_reads.tsv- Collection of mapping and quantification statistics including number of reads uniquely and multi-mapped to either host or pathogen transcriptome using STAR, unmapped reads, trimmed reads and number of assigned reads to the pathogen and host by HTSeq.
-
mapping_stats_samples_total_reads.tsv- Set of mapping and quantification statistics extracted from
salmon_alignment_host_pathogen_total_reads.tsvtable used to createmapping_stats_samples_total_reads.pdfplot.
- Set of mapping and quantification statistics extracted from
-
mapping_stats_samples_total_reads.pdf- Visualisation of mapping statistics from
mapping_stats_samples_total_reads.tsvtable.
- Visualisation of mapping statistics from
-
mapping_stats_samples_percentage.tsv- Mapping statistics from
mapping_stats_samples_total_reads.tsvtable expressed in percentage.
- Mapping statistics from
-
mapping_stats_samples_percentage.pdf- Visualisation of mapping statistics from
mapping_stats_samples_percentage.tsvtable.
- Visualisation of mapping statistics from
-
RNA_classes_pathogen-
pathogen_RNA_classes_sum_counts_salmon.tsv- Tab delimited file containing pathogen RNA class statistics for each sample.
-
pathogen_RNA_classes_percentage_salmon.tsv- Pathogen RNA class statistics from
pathogen_RNA_classes_sum_counts_salmon.tsvtable expressed in percentage.
- Pathogen RNA class statistics from
-
RNA_class_stats_combined_pathogen.pdf- Plot showing pathogen RNA class statistics for all samples from
pathogen_RNA_classes_percentage_htseq.tsvtable.
- Plot showing pathogen RNA class statistics for all samples from
-
sample.pdf- Visualization of pathogen RNA classes statistics for a sample.
-
-
RNA_classes_host-
host_RNA_classes_sum_counts_salmon.tsv- Tab delimited file containing host RNA class statistics for each sample.
-
host_RNA_classes_percentage_salmon.tsv- Host RNA class statistics from
host_RNA_classes_sum_counts_salmon.tsvtable expressed in percentage.
- Host RNA class statistics from
-
host_gene_types_groups_transcript.tsv- Tab delimited file containing list of host transcripts, including transcript_id, transcript_name, gene ids, gene names, counts obtained from quantification, and gene types assigned to each gene considering RNA class groups defined by
--RNA_classes_to_replace_host. For more information check parameters.md. This table is created only for examination of results.
- Tab delimited file containing list of host transcripts, including transcript_id, transcript_name, gene ids, gene names, counts obtained from quantification, and gene types assigned to each gene considering RNA class groups defined by
-
RNA_class_stats_combined_host.pdf- Visualization of host RNA class statistics for all samples from
host_RNA_classes_percentage_salmon.tsvtable.

- Visualization of host RNA class statistics for all samples from
-
sample.pdf- Visualization of host RNA classes statistics for a sample.
-
MultiQC
MultiQC is a visualization tool that generates a single HTML report summarizing all samples in your project. Most of the pipeline QC results are visualised in the report and further statistics are available in the report data directory.
The pipeline has special steps which also allow the software versions to be reported in the MultiQC output for future traceability.
Output directory: results/MultiQC
Contents:
ProjectName_multiqc_report.html- MultiQC report - a standalone HTML file that can be viewed in your web browser
ProjectName_multiqc_report_data/- Directory containing parsed statistics from the different tools used in the pipeline
multiqc_plots/- Directory containing plots from within the .html report, saved as
PDF,PNGandSVG
- Directory containing plots from within the .html report, saved as
For more information about how to use MultiQC reports, see http://multiqc.info.
Pipeline information
Nextflow provides excellent functionality for generating various reports relevant to the running and execution of the pipeline. This will allow you to troubleshoot errors with the running of the pipeline, and also provide you with other information such as launch commands, run times and resource usage.
Output directory: results/pipeline_info
Contents:
-
pipeline_info/-
Reports generated by Nextflow:
execution_report.html,execution_timeline.html,execution_trace.txtandpipeline_dag.dot/pipeline_dag.svg. -
Reports generated by the pipeline:
pipeline_report.html,pipeline_report.txtandsoftware_versions.csv. -
Documentation for interpretation of results in HTML format:
results_description.html.
-