nf-core/hlatyping
Precision HLA typing from next-generation sequencing data
Introduction
This document describes the output produced by the pipeline. Most of the plots are taken from the MultiQC report, which summarises results at the end of the pipeline.
The directories listed below will be created in the results directory after the pipeline has finished. All paths are relative to the top-level results directory.
Pipeline overview
The pipeline is built using Nextflow and processes data using the following steps:
- cat - Merge FastQ files
- FastQC - Raw read QC
- OptiType - HLA genotyping based on integer linear programming
- HLA-HD - HLA Class I + II genotyping (optional, requires a local installation of HLA-HD)
- MultiQC - Aggregate report describing results from the whole pipeline
- Pipeline information - Report metrics generated during the workflow execution
cat
Output files
fastq/*.merged.fastq.gz: If--save_merged_fastqis specified, concatenated FastQ files will be placed in this directory.
If multiple libraries/runs have been provided for the same sample in the input samplesheet (e.g. to increase sequencing depth) then these will be merged at the very beginning of the pipeline in order to have consistent sample naming throughout the pipeline. Please refer to the usage documentation to see how to specify these samples in the input samplesheet.
FastQC
Output files
fastqc/*_fastqc.html: FastQC report containing quality metrics.*_fastqc.zip: Zip archive containing the FastQC report, tab-delimited data file and plot images.
FastQC gives general quality metrics about your sequenced reads. It provides information about the quality score distribution across your reads, per base sequence content (%A/T/G/C), adapter contamination and overrepresented sequences. For further reading and documentation see the FastQC help pages.
OptiType
OptiType is an HLA genotyping algorithm based on linear integer programming. It provides accurate 4-digit HLA genotyping predictions from NGS data. For further reading and documentation see the OptiType documentation.
The pipeline results contain a CSV file with the predicted HLA genotype. Each line contains one solution with the predicted HLA alleles in 4-digit nomenclature, the number of reads that are covered by this solution and the objective function value. If the number of enumerations (—enumerate N) is higher than 1, the CSV file will contain the optimal and sub-optimal solutions.
A1 A2 B1 B2 C1 C2 Reads Objective
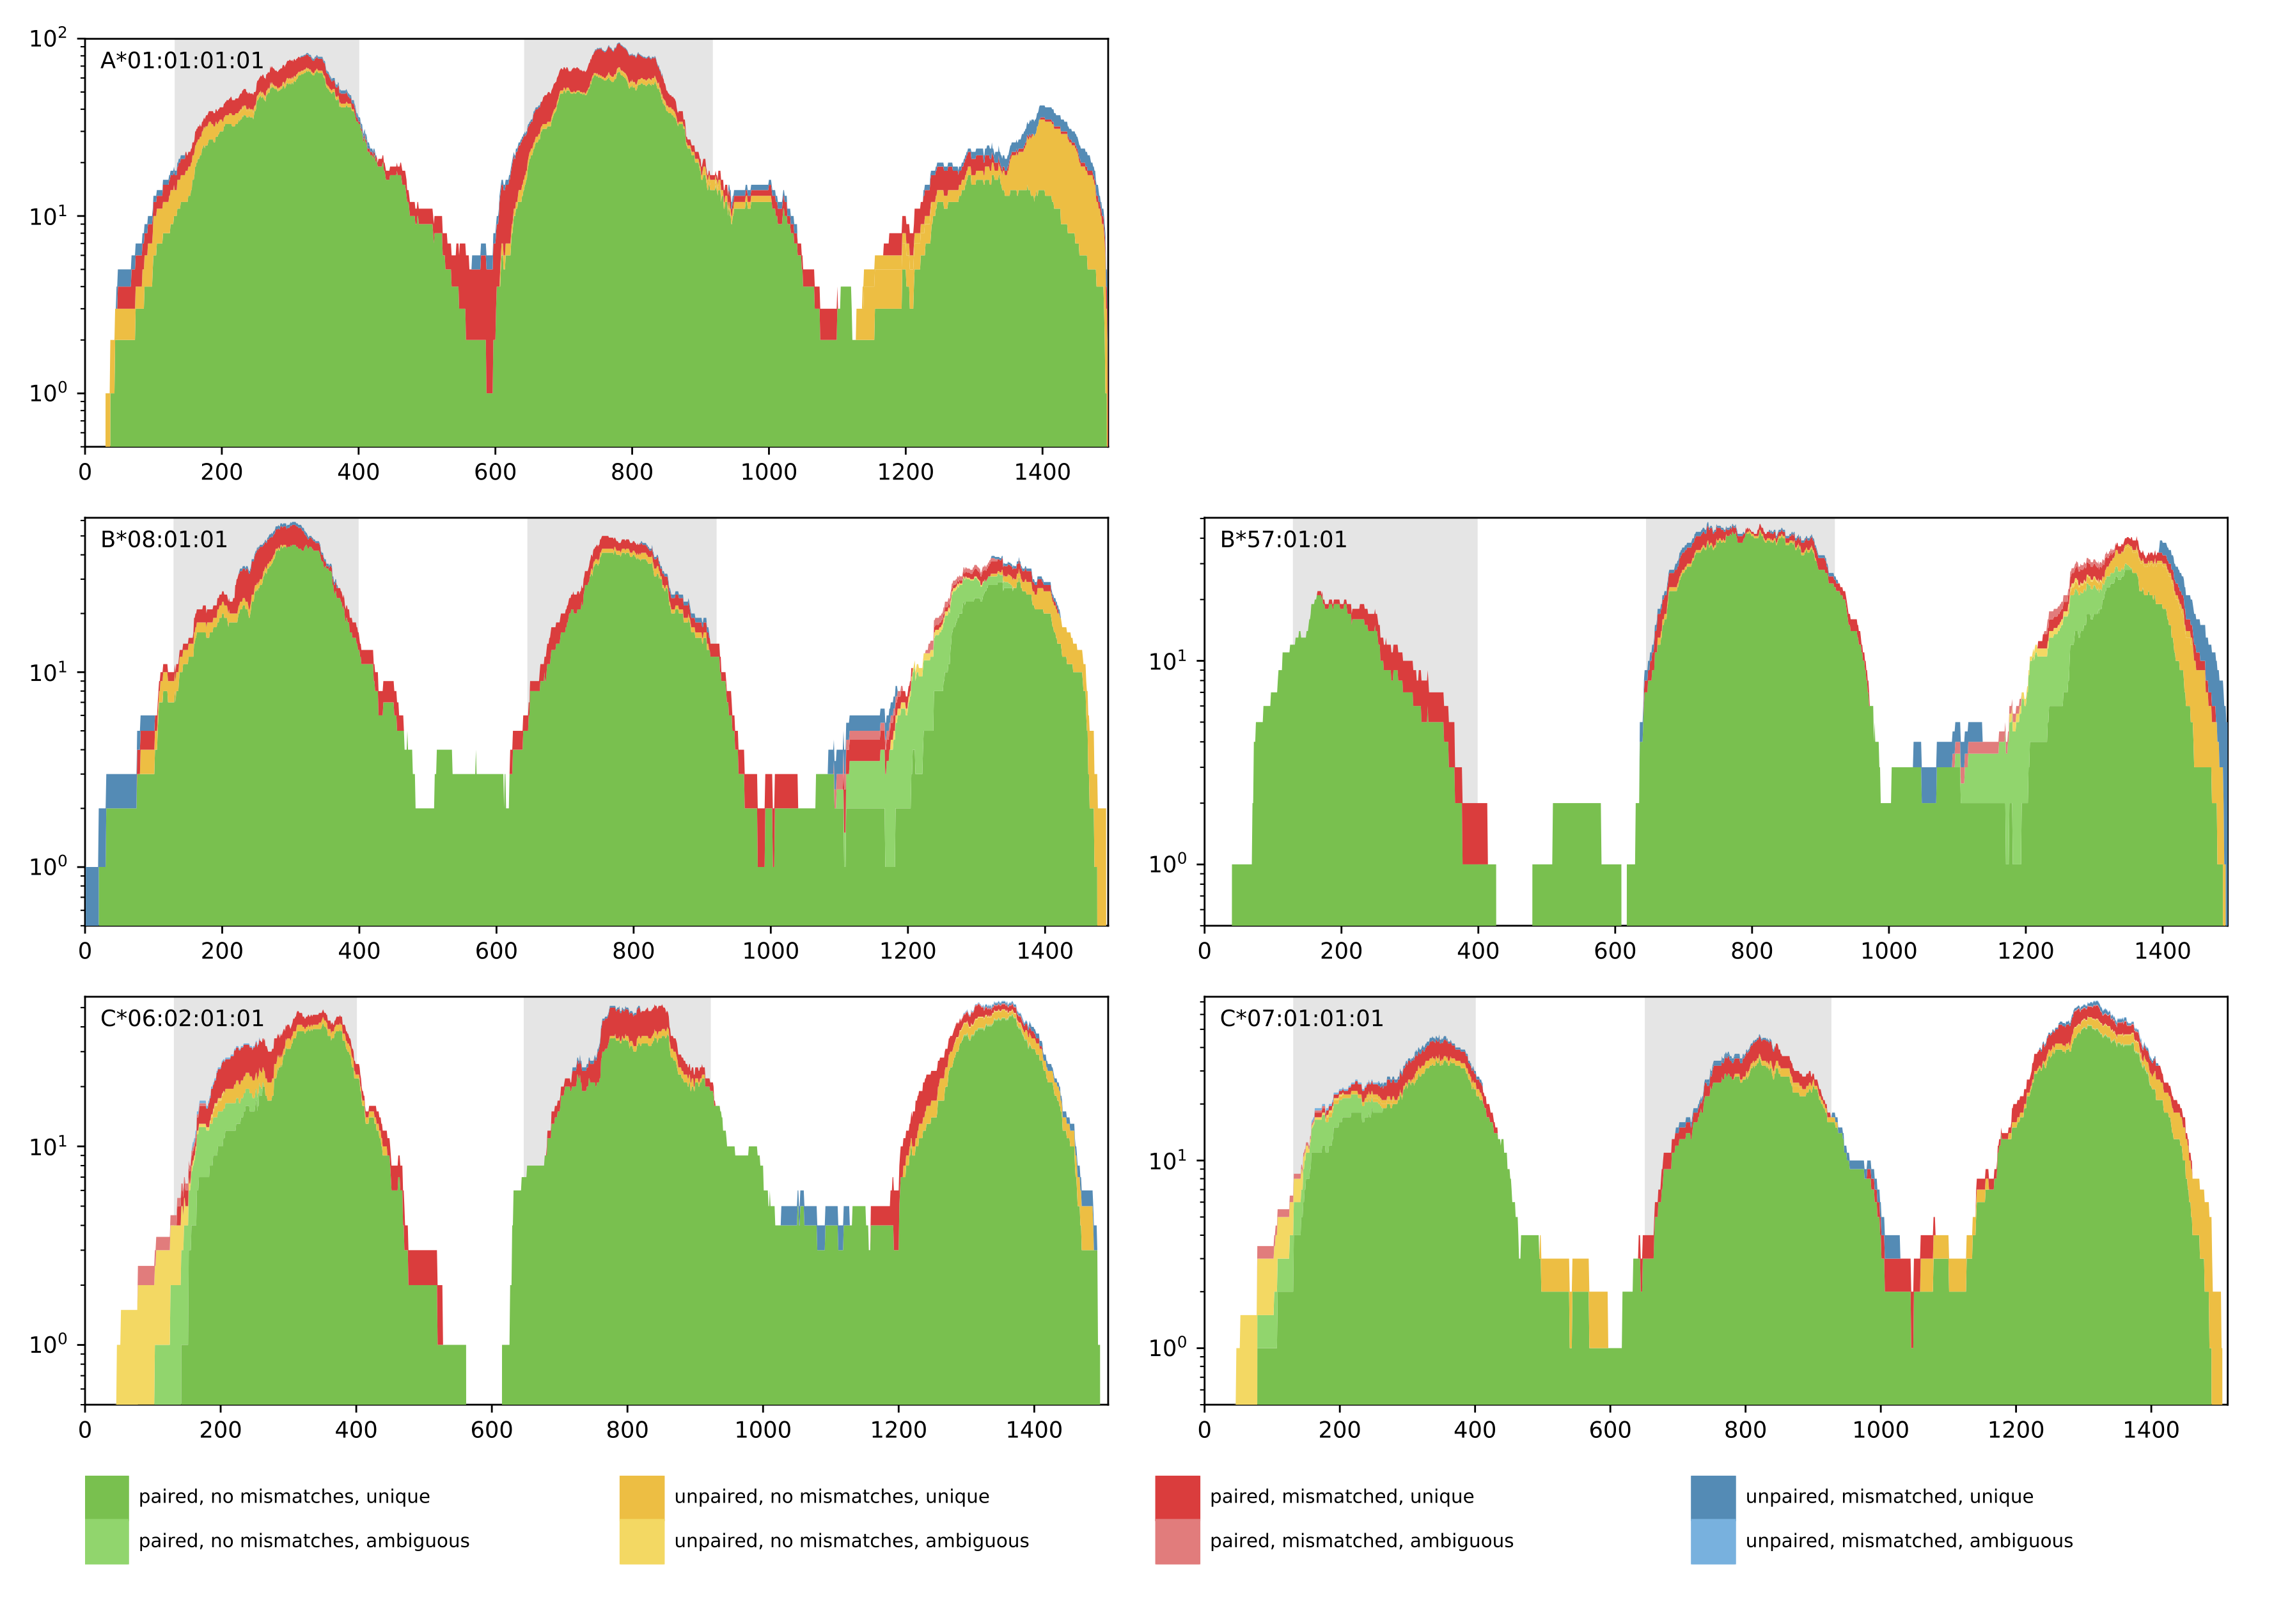
0 A*01:01 A*01:01 B*08:01 B*57:01 C*07:01 C*06:02 1127.0 1106.7139999999997Additionally, a coverage plot of the predicted HLA genotype is produced for quality control purposes (see below). The coverage plot shows the amount of reads that cover every position of the selected HLA allele sequence. Further, the color encoding denotes if reads are paired or unpaired, contain mismatches, and if the matches are unique or ambiguous. In case of homozygous solutions, the coverage plot of the corresponding HLA allele will be shown once.
HLA-HD
HLA-HD (HLA typing from High-quality Dictionary) is an HLA genotyping algorithm that utilizes an extensive dictionary of HLA alleles and a unique mapping strategy. It calculates scores based on weighted read counts to select the most suitable allele pairs. Unlike many other tools, HLA-HD can provide accurate HLA genotyping predictions with up to 6-digit (3-field) precision from WGS, WES, and RNA-Seq data. For further reading and documentation see the HLA-HD website.
Note: HLA-HD is not distributed with the pipeline’s containers due to licensing restrictions. The software is freely available for academic and non-commercial research purposes, but users must register and download it directly from the provider. Commercial use requires a specific license.
The pipeline results contain a text file (*_final.result.txt) with the predicted HLA genotype. Each line represents a specific HLA gene locus and contains the best-matched allele pair in up to 6-digit nomenclature.
A A*24:02:01:01 A*33:03:01
B B*44:03:01  B*58:01:01:01
C C*03:02:02:01 C*14:03
DRB1  DRB1*04:05:01 DRB1*13:02:01
DQB1  DQB1*04:01:01 DQB1*06:04:01
DPB1  DPB1*04:01:01:01  DPB1*04:02:01:01
...
Output directory: results/{timestamp}
{prefix}_{timestamp}_result.tsv- TSV file, containing the predicted optimal (anf if enumerated, sub-optimal) HLA genotype
{prefix}_{timestamp}_coverage_plot.pdf- pdf file, containing a coverage plot of the predicted alleles
MultiQC
Output files
multiqc/multiqc_report.html: a standalone HTML file that can be viewed in your web browser.multiqc_data/: directory containing parsed statistics from the different tools used in the pipeline.multiqc_plots/: directory containing static images from the report in various formats.
MultiQC is a visualization tool that generates a single HTML report summarising all samples in your project. Most of the pipeline QC results are visualised in the report and further statistics are available in the report data directory.
Results generated by MultiQC collate pipeline QC from supported tools e.g. FastQC. The pipeline has special steps which also allow the software versions to be reported in the MultiQC output for future traceability. For more information about how to use MultiQC reports, see http://multiqc.info.
Pipeline information
Output files
pipeline_info/- Reports generated by Nextflow:
execution_report.html,execution_timeline.html,execution_trace.txtandpipeline_dag.dot/pipeline_dag.svg. - Reports generated by the pipeline:
pipeline_report.html,pipeline_report.txtandsoftware_versions.yml. Thepipeline_report*files will only be present if the--email/--email_on_failparameter’s are used when running the pipeline. - Reformatted samplesheet files used as input to the pipeline:
samplesheet.valid.csv. - Parameters used by the pipeline run:
params.json.
- Reports generated by Nextflow:
Nextflow provides excellent functionality for generating various reports relevant to the running and execution of the pipeline. This will allow you to troubleshoot errors with the running of the pipeline, and also provide you with other information such as launch commands, run times and resource usage.