nf-core/marsseq
MARS-seq v2 pre-processing pipeline with velocity
Introduction
This document describes the output produced by the pipeline. Most of the plots are taken from the MultiQC report, which summarises results at the end of the pipeline.
The directories listed below will be created in the results directory after the pipeline has finished. All paths are relative to the top-level results directory.
Pipeline overview
The pipeline is built using Nextflow and processes data using the following steps:
- Download and build references - Build references needer to run the pipeline
- Prepare pipeline
- Label reads
- Align reads
- Demultiplexing
- Quality control
- Workflow reporting and genomes
- Pipeline information - Report metrics generated during the workflow execution
The pipeline is executed per Batch and therefore the folder structure looks like following:
results/|-- multiqc|-- pipeline_info|-- references`-- <batch>Download and build references
Output files
.└── <genome> ├── bowtie2 │ ├── <genome>.1.bt2 │ ├── <genome>.2.bt2 │ ├── <genome>.3.bt2 │ ├── <genome>.4.bt2 │ ├── <genome>.rev.1.bt2 │ └── <genome>.rev.2.bt2 ├── <genome>.fa ├── <genome>.gtf ├── star │ ├── chrLength.txt │ ├── chrNameLength.txt │ ├── chrName.txt │ ├── chrStart.txt │ ├── exonGeTrInfo.tab │ ├── exonInfo.tab │ ├── geneInfo.tab │ ├── Genome │ ├── genomeParameters.txt │ ├── Log.out │ ├── SA │ ├── SAindex │ ├── sjdbInfo.txt │ ├── sjdbList.fromGTF.out.tab │ ├── sjdbList.out.tab │ └── transcriptInfo.tab └── versions.ymlThe pipeline downloads references from GENCODE database. This is required, because
the MARS-seq is using ERCC spike-ins, which have to be appended. Next it builds
bowtie2 index. If --velocity flag is set, star index is also built.
Prepare pipeline
Output files
data/amp_batches.txt: Amplification batchesgene_intervals.txt: Information about gene (chromosome, start, end, strand and symbol)seq_batches.txt: Sequencing batcheswells_cells.txt: Well cells*fastq.gz: Raw reads
At the beginning the pipeline validates the input *xlsx files which are further
converted into .txt files. The majority of internal tools are written in Perl
by the original authors. The nf-core/marsseq is trying to simplify these steps
while replicating the necessary formats and executions in the background. Because
the pipeline uses bowtie2 as a default aligner, reads are furher split into
subfiles of 4,000,000 reads per file so the aligner doesn’t run out of memory.
Label reads
In this intermediate step, reads are further processed and barcodes (CB + UMI) is transferred from R2 to R1. This is important as the CB is further used in the demultiplexing step.
R1structure: LA (3bp) + PB (4bp) + cDNA (66bp) + RA (2bp)R2structure: CB (7bp) + UMI (8bp)
where
- LA: left adapter
- PB: pool barcode
- RA: right adapter
- CB: cell barcode
- UMI: Unique Molecular Indentifier
In this step, files are not saved in the overal results, they reside in the work
folder.
Align reads
Split reads are aligned using bowtie2. Next, all the aligned reads are merged
into one SAM file which is used as an input for demultiplexing.
If --velocity flag is set, the reads are also aligned using StarSolo to estimated
both spliced and unspliced reads which can be used for RNA velocity estimation.
This is an additional plugin which we developed. In short MARS-seq2.0 reads are
converted to 10X v2 format. Additionally, a whitelist is generated for aligned
to perform demultiplexing.
Output files
<batch><batch>.sam: Merged aligned reads into one SAM file withbowtie2velocity/Solo.out/*: Output from StarSolo (Gene, GeneFull, SJ, Velocyto and Barcode.stats)Aligned.sortedByCoord.out.bam: Aligned readsLog.final.out: STAR alignment report containing the mapping results summaryLog.outandLog.progress.out: STAR log files containing detailed information about the run. Typically only useful for debugging purposes<batch>.cutadapt.log: Log file from runningcutadapt<batch>_{1,2}.trim.fastq.gz: Trimmed pair-end converted10X v2readsSJ.out.tab: File containing filtered splice junctions detected after mapping the readswhitelist.txt: File containing cell barcodes (combination of pool and cell barcode)
Demultiplexing
Output files
<batch>output/_debug: Debugging informationoffset.tab/: A directory that contains tables with the number of IVT products per each(well,gene) pair of all the processed amplification batches where each row is a gene and each column is a well/cell. The filename of a table corresponds to it’s amplification batch ([amplification batch ID].txt)QC: Intermediate QC stats later used to generateQC_reportssingleton_offset.tab: A directory that contains tables with the number of molecules with a single IVT products per each(well,gene) pair of all the processed amplification batches where each row is a gene and each column is a well/cell. The filename of a table corresponds to it’s amplification batch (`[amplification batch ID].txt)umi.tab: A directory that contains the expression tables of all the processed amplification batches. Each table contains he number of detected molecules for each (well,gene) pair where each row is a gene and each column is a well/cell. The filename of a table corresponds to it’s amplification batch ([amplification batch ID].txt)amp_batches_stats.txt:amp_batches_summary.txt:
Demultiplexing step where pipeline generates a count matrix for invidivual
amplification batch. The count matrix can be found in <batch>/output/umi.tab.
The information above have been taken from original documentation for MARS-seq2.0
which can be round here.
QC
QC report
Output files
<batch>output/QC_reports: For each sequencing batch a QC report is generated in[sequencing batch ID].pdf. Each contains a detailed QC reports for all the amplification batches associated with it.
Internal script for generating QC report after bowtie2 alignment and demultiplexing.
FastQC
Output files
fastqc/*_fastqc.html: FastQC report containing quality metrics.*_fastqc.zip: Zip archive containing the FastQC report, tab-delimited data file and plot images.
FastQC gives general quality metrics about your sequenced reads. It provides information about the quality score distribution across your reads, per base sequence content (%A/T/G/C), adapter contamination and overrepresented sequences. For further reading and documentation see the FastQC help pages.

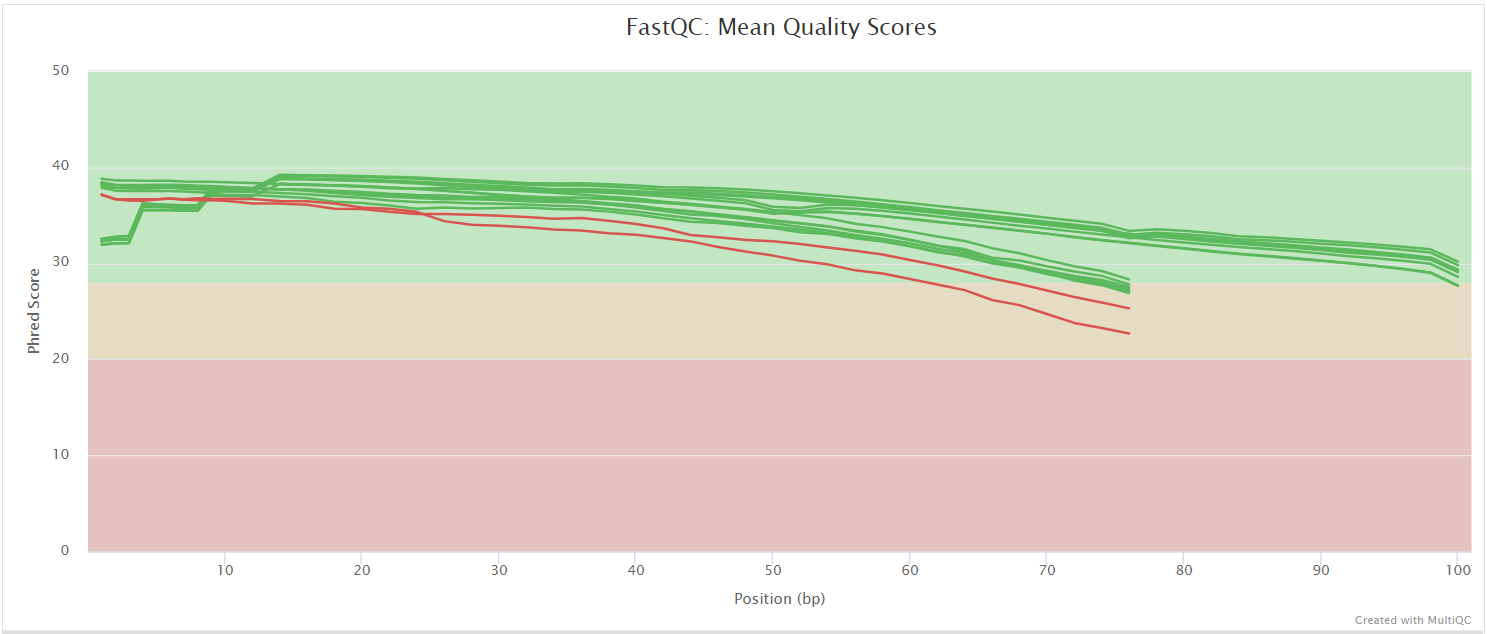
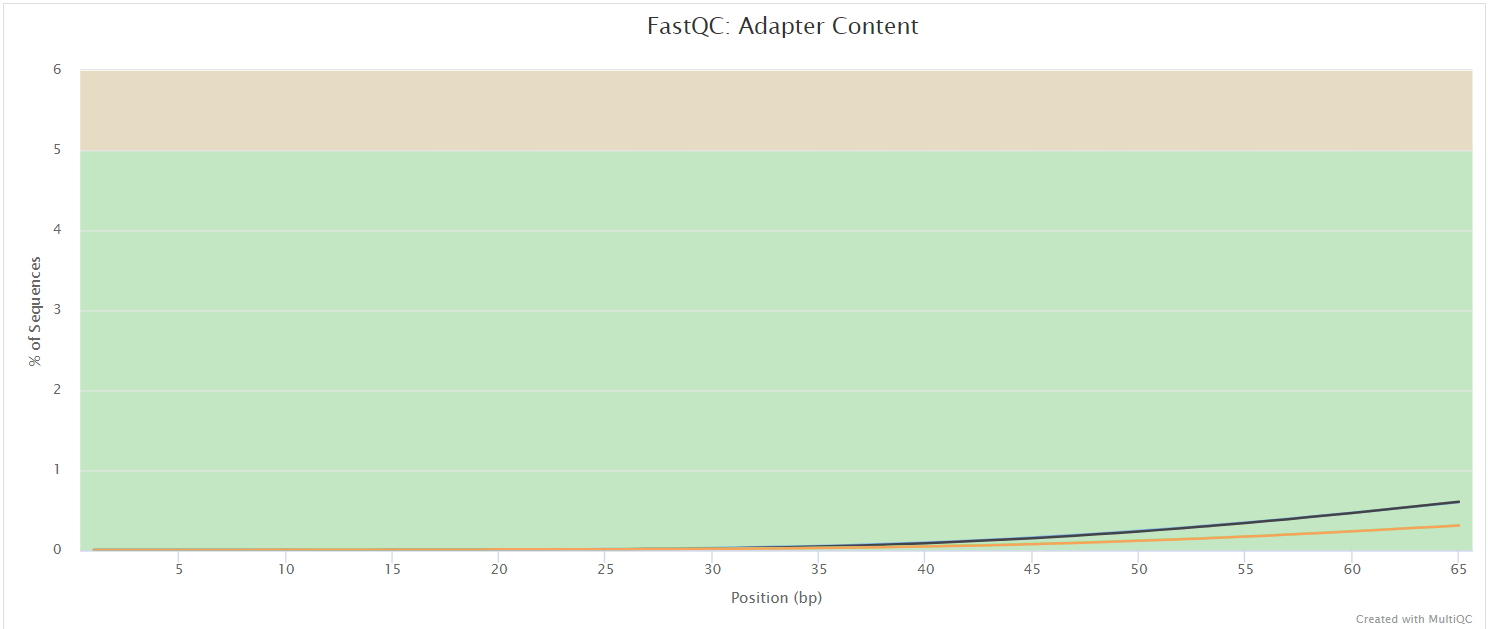
NB: The FastQC plots displayed in the MultiQC report shows untrimmed reads. They may contain adapter sequence and potentially regions with low quality.
MultiQC
Output files
multiqc/multiqc_report.html: a standalone HTML file that can be viewed in your web browser.multiqc_data/: directory containing parsed statistics from the different tools used in the pipeline.multiqc_plots/: directory containing static images from the report in various formats.
MultiQC is a visualization tool that generates a single HTML report summarising all samples in your project. Most of the pipeline QC results are visualised in the report and further statistics are available in the report data directory.
Results generated by MultiQC collate pipeline QC from supported tools e.g. FastQC. The pipeline has special steps which also allow the software versions to be reported in the MultiQC output for future traceability. For more information about how to use MultiQC reports, see http://multiqc.info.
Workflow reporting and genomes
Pipeline information
Output files
pipeline_info/- Reports generated by Nextflow:
execution_report.html,execution_timeline.html,execution_trace.txtandpipeline_dag.dot/pipeline_dag.svg. - Reports generated by the pipeline:
pipeline_report.html,pipeline_report.txtandsoftware_versions.yml. Thepipeline_report*files will only be present if the--email/--email_on_failparameter’s are used when running the pipeline. - Reformatted samplesheet files used as input to the pipeline:
samplesheet.valid.csv.
- Reports generated by Nextflow:
Nextflow provides excellent functionality for generating various reports relevant to the running and execution of the pipeline. This will allow you to troubleshoot errors with the running of the pipeline, and also provide you with other information such as launch commands, run times and resource usage.