nf-core/meerpipe
nf-core/meerpipe is a astronomy pipeline that processes MeerKAT pulsar data to produce images and data products for pulsar timing analysis
Introduction
nf-core/meerpipe is a astronomy pipeline that processes MeerKAT pulsar data to produce images and data products for pulsar timing analysis as part of the MeerTime project (Bailes et al. 2020). The images and results are uploaded to the Meertime data portal where the observation quality can be checked before downloading the results and pulse Time of Arrivals (ToA) using psrdb.
The pipeline is described by the following flow diagram and bullet points:
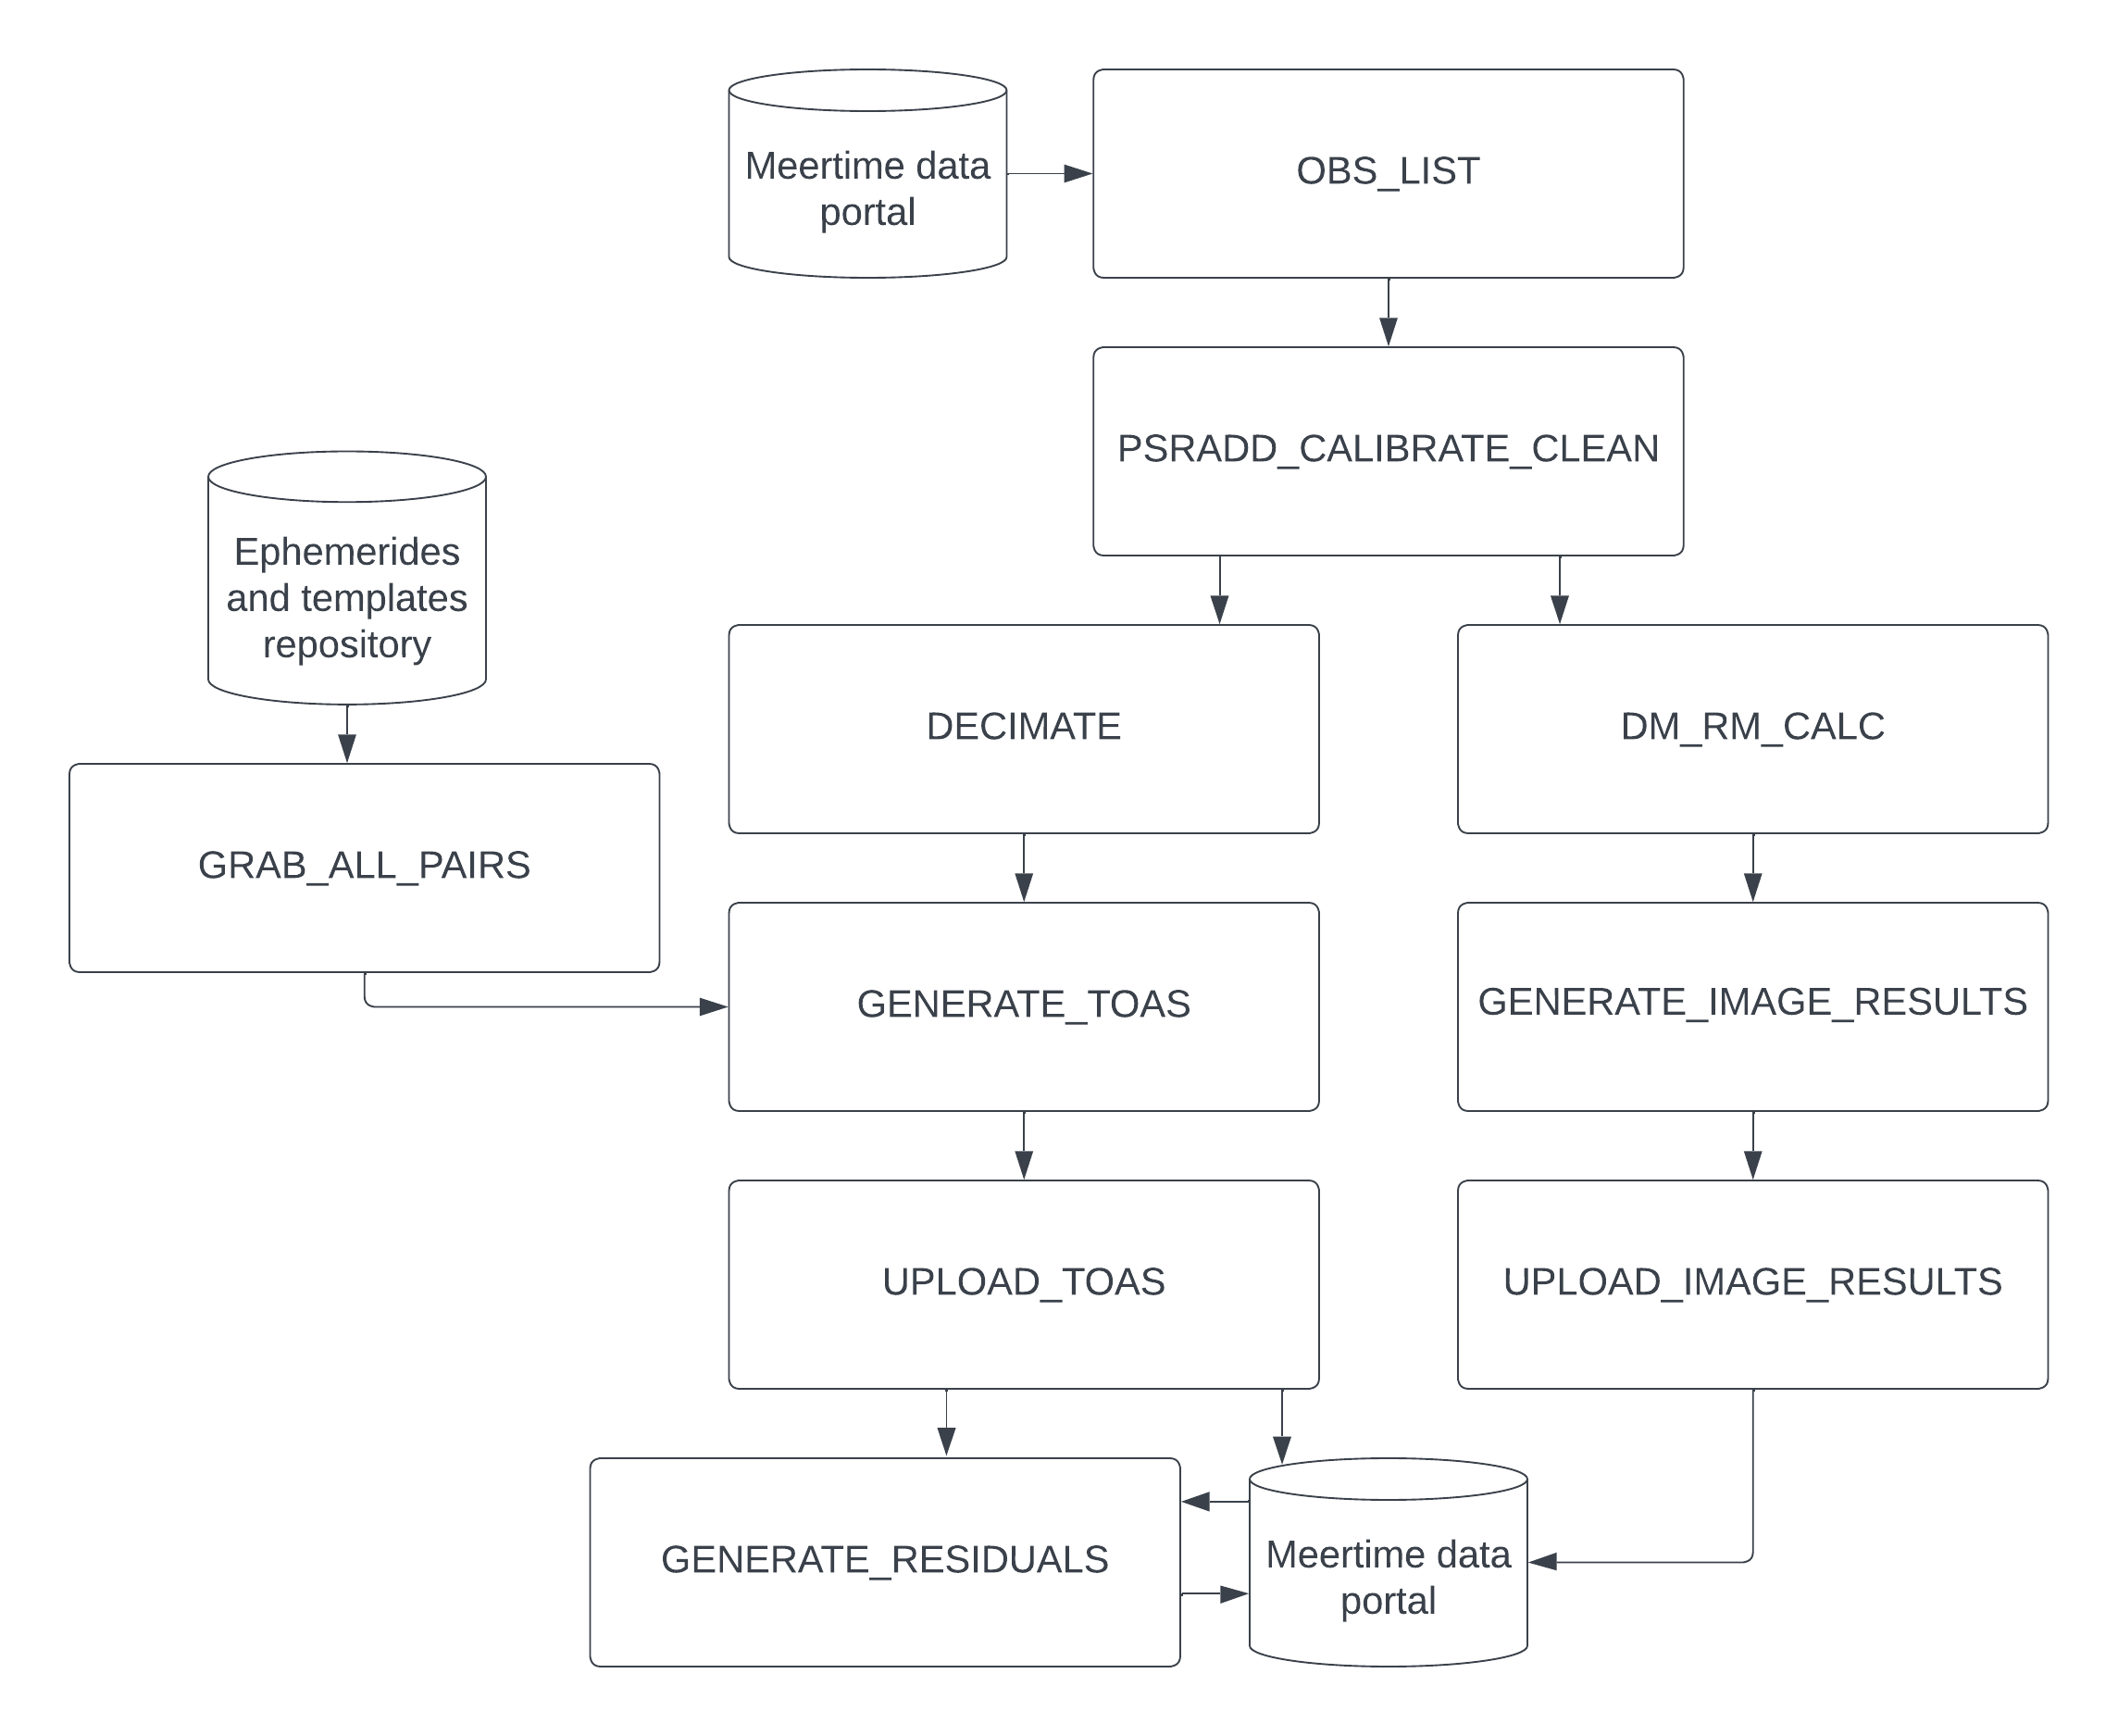
- OBS_LIST: Queries the MeerTime database for observations that match the input filters (described in the usage section), download their metadata and find the corresponding ephemerides and template files from the private repository.
- PSRADD_CALIBRATE_CLEAN: Prepares a cleaned and calibrated archive in the following steps:
- Combine the raw archives, except for the first and last ~8 second subint, and clean them of RFI with MeerGuard
- Combine the cleaned chunks into a single file and calibrate the polarisation with pac using the Jones matrices provided by the South African Radio Astronomy Observatory (SARAO) (Serylak et al. 2020)
- Apply the rotation measure from the ATNF and apply it with pam
- Correct for delays using dlyfix
- Calibrate for the flux (adjust the archive values so they are in flux units) using fluxcal_meerkat. Meerpipe uses a bootstrap method to flux calibrate the data. Using the sky map in Calabretta et al. (2014), an initial estimate of the Tsky is computed. However owing to the large disparity in the sky map as comparted to the more resolved MeerKAT beam, a secondary estimate of Tsky is performed directly from the data. This was done by observing a high-latitude pulsar and comparing its RMS with other pulsars observed in that session. This allowed an estimate of a scaling factor used to flux calibrate the data. A detailed description of this method can be found in the TPA census paper.
- Calculate the signal-to-noise ratio (S/N) using psrstat
- Calculate the flux density using pdv
- DM_RM_CALC: Calculate the dispersion measure (DM) and rotation measure (RM).
- For observations with a S/N over 20:
- For observations with a S/N under 20:
- The DM is calculated with pdmp
- The RM is not calculated.
- No template available for the observations or other methods have failed:
- The DM and RM are not calculated.
- GENERATE_IMAGE_RESULTS: Generate the images (described in the output section) and combine results into a
results.jsonfile:- Generate the images using psrplot
- Generate additional images that require Python using generate_image_results which includes dynamic spectrum images created using scintools
- Combine the results into a
results.jsonfile
- UPLOAD_IMAGE_RESULTS: Upload the images and
results.jsonto the Meertime data portal - GRAB_ALL_PAIRS: Grab all pairs of ephemerides and template files from the private repository for each pulsar and project. These will be used to create different ToAs for each project.
- DECIMATE: Remove the edge frequency channels with chop_edge_channels then decimate the archives with pam for each of the combinations of the following params:
nchan: Number of frequency channels, default [1, 8, 16, 29, 58, 116, 928]npol: Polarisation scrunched (1) and full stokes (4), default [1, 4]- nsub (controlled with
use_max_nsub): Number of time subintegrations. A time scrunched (1) and the largest value of nsub possible while maintaining sensitive ToAs (calculated with calc_max_nsub), default [1, max]
- GENERATE_TOAS: Generate ToAs for each combination projects and decimated archives with nchan < 32 using pat
- UPLOAD_TOAS: Upload the ToAs to the Meertime data portal
- GENERATE_RESIDUALS: Once all the UPLOAD_TOA jobs are complete, one of these process will be launched for each pulsar and project. It will download all the ToAs (including those from previous pipeline runs) and generate residuals for each combination of projects and decimated archives using tempo2. These residuals will be uploaded to the Meertime data portal to allow researchers to interactively check the quality of the observations.
Usage
If you are new to Nextflow and nf-core, please refer to this page on how to set-up Nextflow. Make sure to test your setup with -profile test before running the workflow on actual data.
Now, you can run the pipeline using:
nextflow run nf-core/meerpipe \
   -profile <docker/singularity/.../institute> \
   --outdir <OUTDIR> \
   --pulsar J1410-7404 \
   --utcs 2020-09-05-10:00:47 \
--utce 2020-09-05-10:00:47Please provide pipeline parameters via the CLI or Nextflow -params-file option. Custom config files including those provided by the -c Nextflow option can be used to provide any configuration except for parameters;
see docs.
For more details and further functionality, please refer to the usage documentation and the parameter documentation.
Pipeline output
To see the results of an example test run with a full size dataset refer to the results tab on the nf-core website pipeline page. For more details about the output files and reports, please refer to the output documentation.
Credits
nf-core/meerpipe was originally written by Nick Swainston.
We thank the following people for their extensive assistance in the development of this pipeline:
Contributions and Support
If you would like to contribute to this pipeline, please see the contributing guidelines.
For further information or help, don’t hesitate to get in touch on the Slack #meerpipe channel (you can join with this invite).
Citations
An extensive list of references for the tools used by the pipeline can be found in the CITATIONS.md file.
You can cite the nf-core publication as follows:
The nf-core framework for community-curated bioinformatics pipelines.
Philip Ewels, Alexander Peltzer, Sven Fillinger, Harshil Patel, Johannes Alneberg, Andreas Wilm, Maxime Ulysse Garcia, Paolo Di Tommaso & Sven Nahnsen.
Nat Biotechnol. 2020 Feb 13. doi: 10.1038/s41587-020-0439-x.