nf-core/nanoseq
Nanopore demultiplexing, QC and alignment pipeline
1.1.0). The latest stable release is3.1.0.Introduction
This document describes the output produced by the pipeline. Most of the plots are taken from the MultiQC report, which summarises results at the end of the pipeline.
Pipeline overview
The pipeline is built using Nextflow. See main README.md for a condensed overview of the steps in the pipeline, and the bioinformatics tools used at each step.
See Oxford NanoPore website for more information regarding the sequencing technology, protocol, and for an extensive list of resources.
The directories listed below will be created in the output directory after the pipeline has finished. All paths are relative to the top-level results directory.
Basecalling and demultiplexing
Output files
guppy/fastq/
Merged fastq output files for each barcode.guppy/basecalling/<barcode*>/
fastq output files for each barcode.guppy/basecalling/unclassified/
fastq files with reads were unassigned to any given barcode.guppy/basecalling/sequencing_summary.txt
Sequencing summary file generated by Guppy.guppy/basecalling/sequencing_telemetry.js
Sequencing telemetry file generated by Guppy.guppy/basecalling/guppy_basecaller_log-<date>.log
Log file for Guppy execution.qcat/fastq/<barcode*>.fastq.gz
fastq output files for each barcode.qcat/fastq/none.fastq.gz
fastq file with reads were unassigned to any given barcode.
Description:
The pipeline has been written to deal with the various scenarios where you would like to include/exclude the basecalling and demultiplexing steps. This will be dependent on what type of input data you would like to provide the pipeline. Additionally, if you would like to align your samples to a reference genome there are various options for providing this information. Please see usage.md for more details about the format of the input samplesheet, associated commands and how to provide reference genome data.
Guppy will be used to basecall and demultiplex the data. Various options have been provided to customise specific parameters and to be able to run Guppy on GPUs.
If you have a pre-basecalled fastq file then qcat will be used to perform the demultiplexing if you provide the --skip_basecalling parameter. If you would like to skip both of these steps entirely then you can provide --skip_basecalling --skip_demultiplexing when running the pipeline. As a result, the structure of the output folder will depend on which steps you have chosen to run in the pipeline.
Sequencing QC
Output files
pycoqc/pycoqc.html
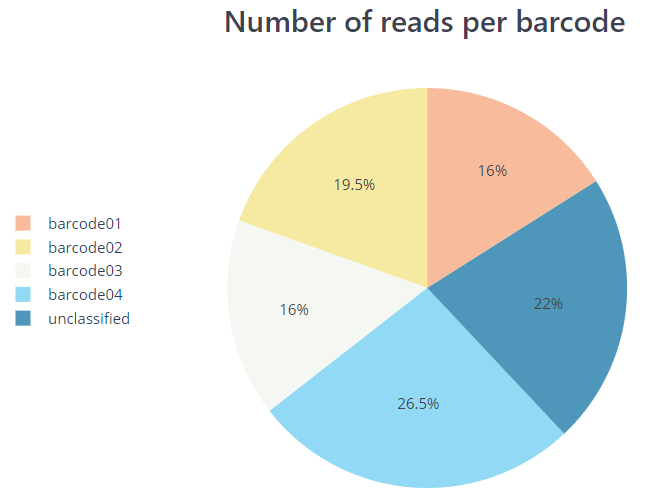
*.htmlfile that includes a run summary and graphical representation of various QC metrics including distribution of read length, distribution of read quality scores, mean read quality per sequence length, output per channel over experiment time and percentage of reads per barcode.nanoplot/summary/
*.htmlfiles for QC metrics and individual*.pngimage files for plots.
Documentation:
PycoQC, NanoPlot
Description:
PycoQC and NanoPlot compute metrics and generate QC plots using the sequencing summary information generated by Guppy e.g. distribution of read length, read length over time, number of reads per barcode and other general stats. NanoPlot also generates QC metrics directly from fastq files as described in the next section.
Read QC
Output files
nanoplot/fastq/<SAMPLE>/
Per-sample*.htmlfiles for QC metrics and individual*.pngimage files for plots.fastqc/
FastQC*.htmland*.zipfiles.
Documentation:
NanoPlot, FastQC
Description:
NanoPlot can also be used to produce general quality metrics from the per-barcode fastq files generated by Guppy e.g. quality score distribution, read lengths and other general stats.
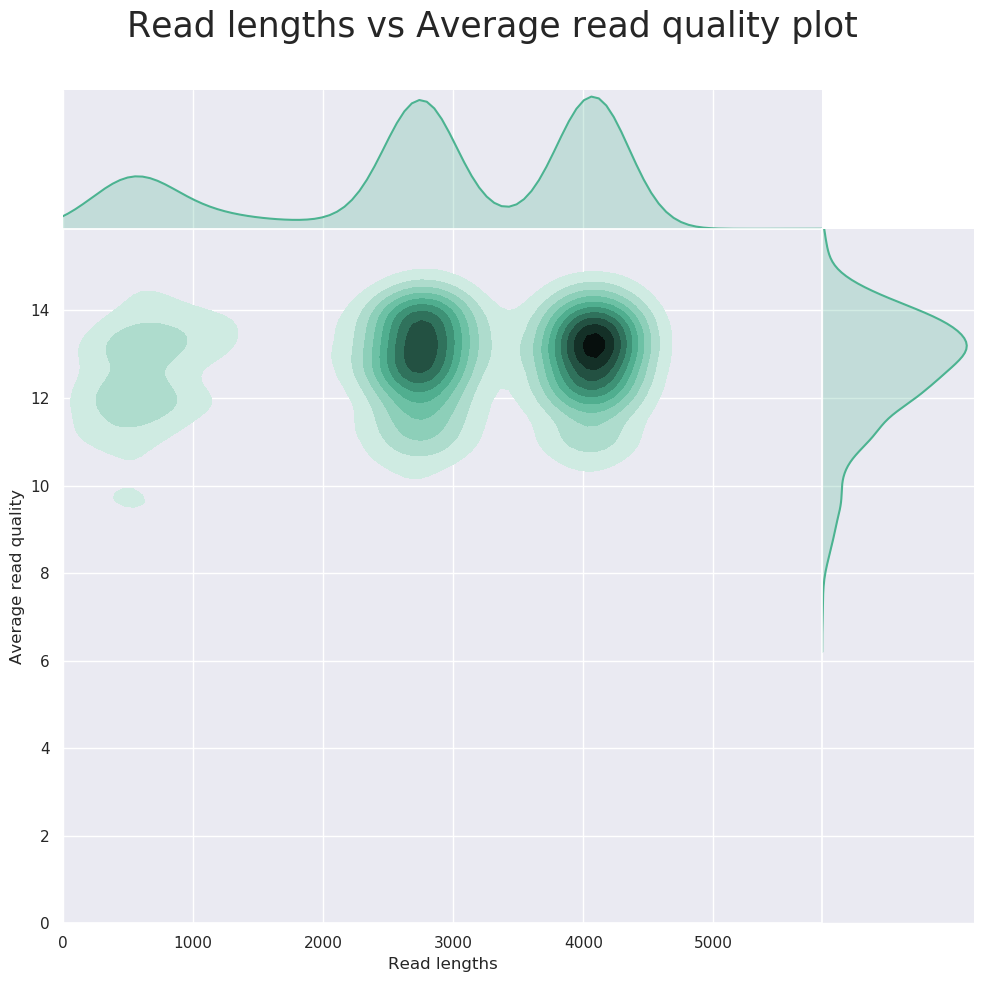
FastQC gives general quality metrics about your reads. It provides information about the quality score distribution across your reads, the per base sequence content (%A/C/G/T). You get information about adapter contamination and other overrepresented sequences.
Alignment
Output files
Documentation:
GraphMap2, MiniMap2, SAMtools
Description:
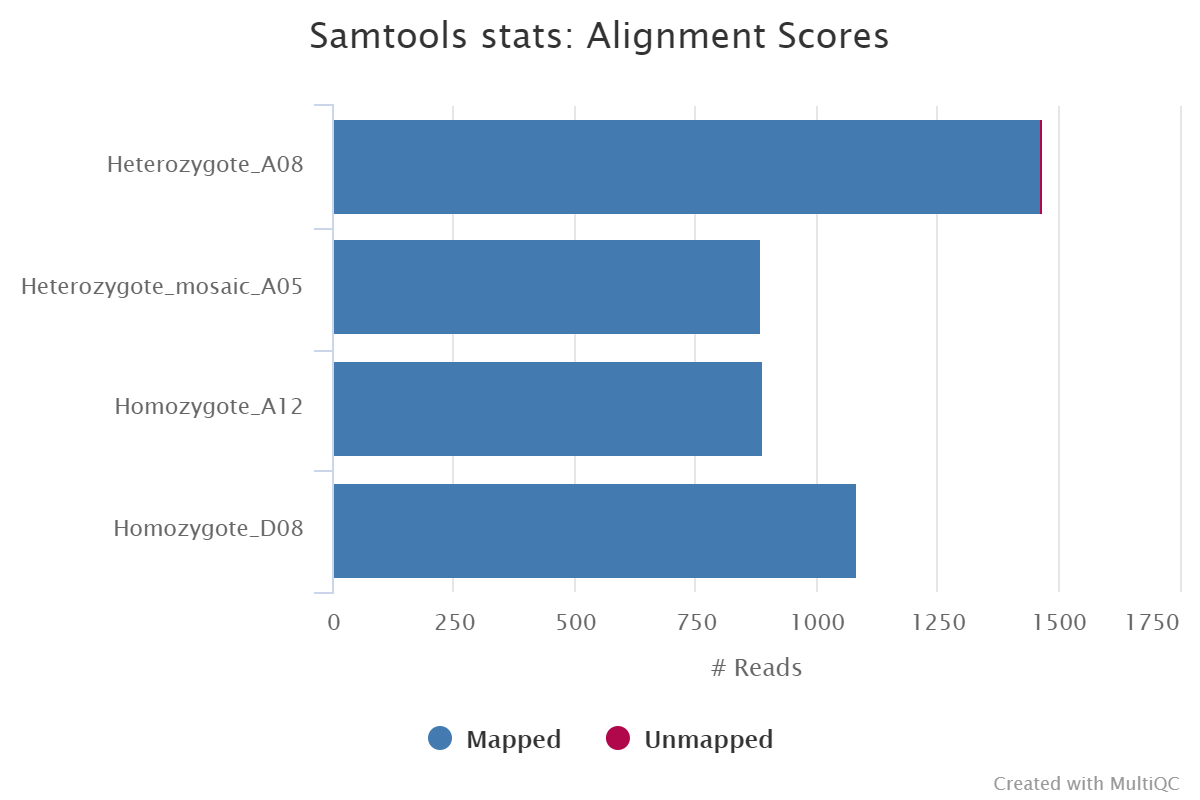
Reads are mapped to a user-defined genome or transcriptome using either GraphMap2 or Minimap2, and the resulting BAM files are sorted and indexed. If the same reference is specified multiple times in the input sample sheet then the aligner index will only be built once for re-use across all samples. You can skip the alignment and downstream processes by providing the --skip_alignment parameter.
The initial SAM alignment files created by GraphMap2 or Minimap2 are not saved by default to be more efficient with storage space. You can override this behaviour with the use of the --save_align_intermeds parameter.
Coverage tracks
Output files
<ALIGNER>/bigwig/
Per-sample*.bigWigfiles.<ALIGNER>/bigbed/
Per-sample*.bigBedfiles.
Documentation:
BEDTools, bedGraphToBigWig, bedToBigBed
Description:
The bigWig format is in an indexed binary format useful for displaying dense, continuous data in Genome Browsers such as the UCSC and IGV. This mitigates the need to load the much larger BAM files for data visualisation purposes which will be slower and result in memory issues. The bigWig format is also supported by various bioinformatics software for downstream processing such as meta-profile plotting.
bigBed are more useful for displaying distribution of reads across exon intervals as is typically observed for RNA-seq data. Therefore, these files will only be generated if --protocol directRNA or --protocol cDNA are defined.
The creation of these files can be bypassed by setting the parameters --skip_bigwig/--skip_bigbed.
Transcript Reconstruction and Quantification
Output files
If bambu is used:
bambu/extended_annotations.gtf- a gtf file that contains both annotated and novel transcriptscounts_gene.txt- gene expression estimatescounts_transcript.txt- transcript expression estimates
If StringTie2 is used:
stringtie2/*.bamPer-sample coordinate sorted alignment files in*.bamformat.*.stringtie.gtfPer-sample annotations for novel transcripts obtained in StringTie2.stringtie.merged.gtfExtended annotation that combines provided gtf with gtf files from each sample via StringTie2 Merge.counts_gene.txt- gene expression estimates calculated by featureCounts.counts_gene.txt.summary- featureCounts gene level log file.counts_transcript.txt- transcript expression estimates calculated by featureCounts.counts_transcript.txt.summary- featureCounts transcript level log file.
Documentation:
bambu, StringTie2, featureCounts
Description:
After genomic alignment, novel transcripts can be reconstructed using tools such as bambu and StringTie2. Quantification can then be performed on a more complete annotation based on the transcripts detected within a given set of samples. bambu performs both the reconstruction and quantification steps. An an alternative approach, we also provides an option to run StringTie2 to identify novel transcripts. However, when multiple samples are provided, quantification for multiple samples are not implemented explicitly in the software. Hence a second step is required to merge novel transcripts across multiple samples followed by quantification for both gene and transcripts using featureCounts. You can skip transcript reconstruction and quantification by providing the --skip_quantification parameter.
Differential expression analysis
Output files
<QUANTIFICATION_METHOD>/deseq2/deseq2.results.txt- a.txtfile that can contains differential expression results for genes.<QUANTIFICATION_METHOD>/dexseq/dexseq.results.txt- a.txtfile that can contains differential expression results for transcripts.
Description:
If multiple conditions and multiple replicates are available then the pipeline is able to run differential analysis on gene and transcripts with DESeq2 and DEXSeq, respectively. These steps won’t be run if you provide the --skip_quantification or --skip_differential_analysis parameters or if all of the samples in the samplesheet don’t have the same fasta and GTF reference files.
MultiQC
Output files
multiqc/multiqc_report.html- a standalone HTML file that can be viewed in your web browser.multiqc_data/- directory containing parsed statistics from the different tools used in the pipeline.multiqc_plots/- directory containing static images from the report in various formats.
Documentation:
MultiQC
Description:
MultiQC is a visualisation tool that generates a single HTML report summarising all samples in your project. Most of the pipeline QC results are visualised in the report and further statistics are available within the report data directory.
Results generated by MultiQC for this pipeline collate QC from FastQC, samtools flagstat, samtools idxstats and samtools stats.
The pipeline has special steps which also allow the software versions to be reported in the MultiQC output for future traceability. For more information about how to use MultiQC reports, see http://multiqc.info.
Pipeline information
Output files
pipeline_info/- Reports generated by the pipeline -
pipeline_report.html,pipeline_report.txtandsoftware_versions.csv. - Reports generated by Nextflow -
execution_report.html,execution_timeline.html,execution_trace.txtandpipeline_dag.svg. - Reformatted sample sheet files used as input to the pipeline -
samplesheet_reformat.csv. - Documentation for interpretation of results in HTML format -
results_description.html.
- Reports generated by the pipeline -
Documentation:
Nextflow
Description:
Nextflow provides excellent functionality for generating various reports relevant to the running and execution of the pipeline. This will allow you to trouble-shoot errors with the running of the pipeline, and also provide you with other information such as launch commands, run times and resource usage.