nf-core/rnasplice
rnasplice is a bioinformatics pipeline for RNA-seq alternative splicing analysis
Introduction
This document describes the output produced by the pipeline. Most of the plots are taken from the MultiQC report generated from the full-sized test dataset for the pipeline using a command similar to the one below:
nextflow run nf-core/rnasplice -profile test_full,<docker/singularity/institute>The directories listed below will be created in the results directory after the pipeline has finished. All paths are relative to the top-level results directory.
Pipeline overview
The pipeline is built using Nextflow and processes data using the following steps:
- Preprocessing
- cat - Merge re-sequenced FastQ files.
- FastQC - Raw read QC.
- TrimGalore - Adapter and quality trimming
- Alignment and quantification.
- STAR and Salmon - Fast spliced aware genome alignment and transcriptome quantification.
- STAR and featureCounts - Memory efficient quantification.
- STAR and DEXSeq Count - Alignment and quantification of expression levels
- Alignment post-processing.
- SAMtools - Sort and index alignments
- Other steps.
- BEDTools and bedGraphToBigWig - Create bigWig coverage files
- Quality control.
- MultiQC - Aggregate report describing results and QC from the whole pipeline
- Pseudo-alignment and quantification.
- Salmon - Wicked fast gene and isoform quantification relative to the transcriptome
- Differential Exon Usage (DEU).
- Differential Transcript Usage (DTU).
- Event-based Differential Splicing analysis.
- Workflow reporting and genomes
- Reference genome files - Saving reference genome indices/files
- Pipeline information - Report metrics generated during the workflow execution
Preprocessing
cat
Output files
fastq/*.merged.fastq.gz: If--save_merged_fastqis specified, concatenated FastQ files will be placed in this directory.
If multiple libraries/runs have been provided for the same sample in the input samplesheet (e.g. to increase sequencing depth) then these will be merged at the very beginning of the pipeline in order to have consistent sample naming throughout the pipeline. Please refer to the usage documentation to see how to specify these samples in the input samplesheet.
FastQC
Output files
fastqc/*_fastqc.html: FastQC report containing quality metrics.*_fastqc.zip: Zip archive containing the FastQC report, tab-delimited data file and plot images.
NB: The FastQC plots in this directory are generated relative to the raw, input reads. They may contain adapter sequence and regions of low quality. To see how your reads look after adapter and quality trimming please refer to the FastQC reports in the
trimgalore/fastqc/directory.
FastQC gives general quality metrics about your sequenced reads. It provides information about the quality score distribution across your reads, per base sequence content (%A/T/G/C), adapter contamination and overrepresented sequences. For further reading and documentation see the FastQC help pages.
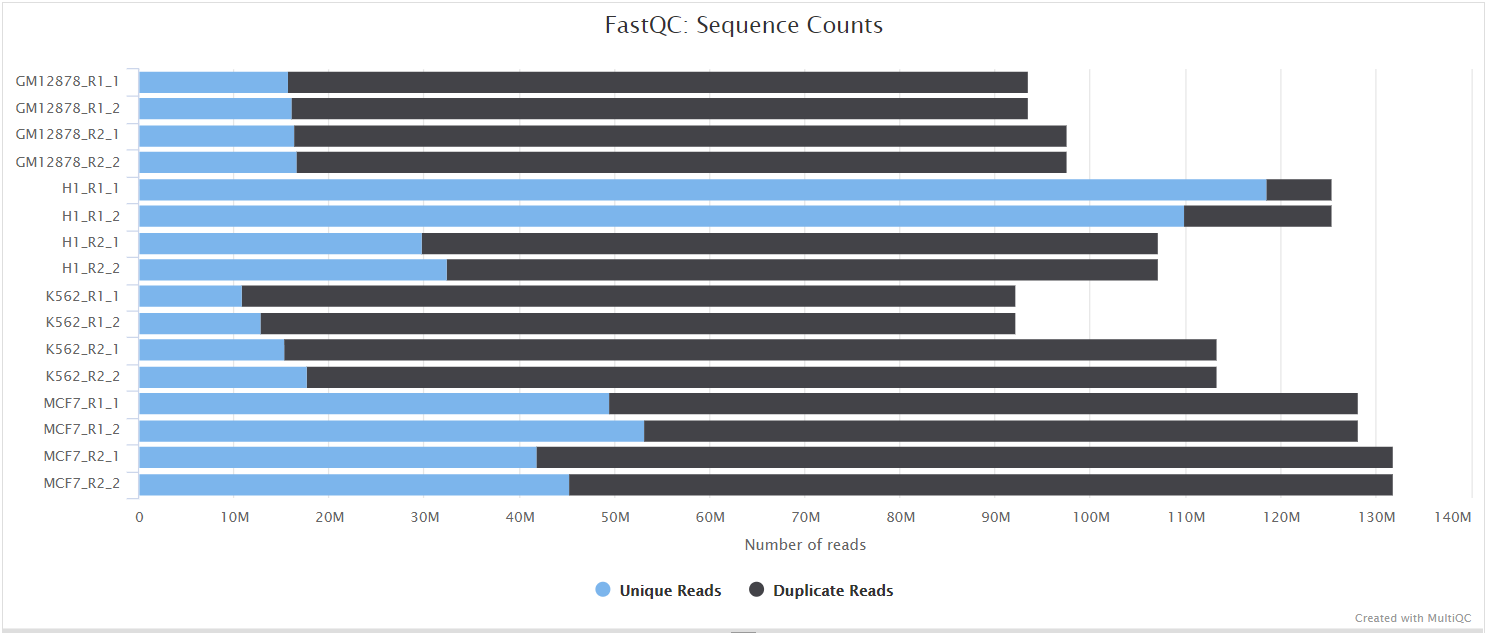
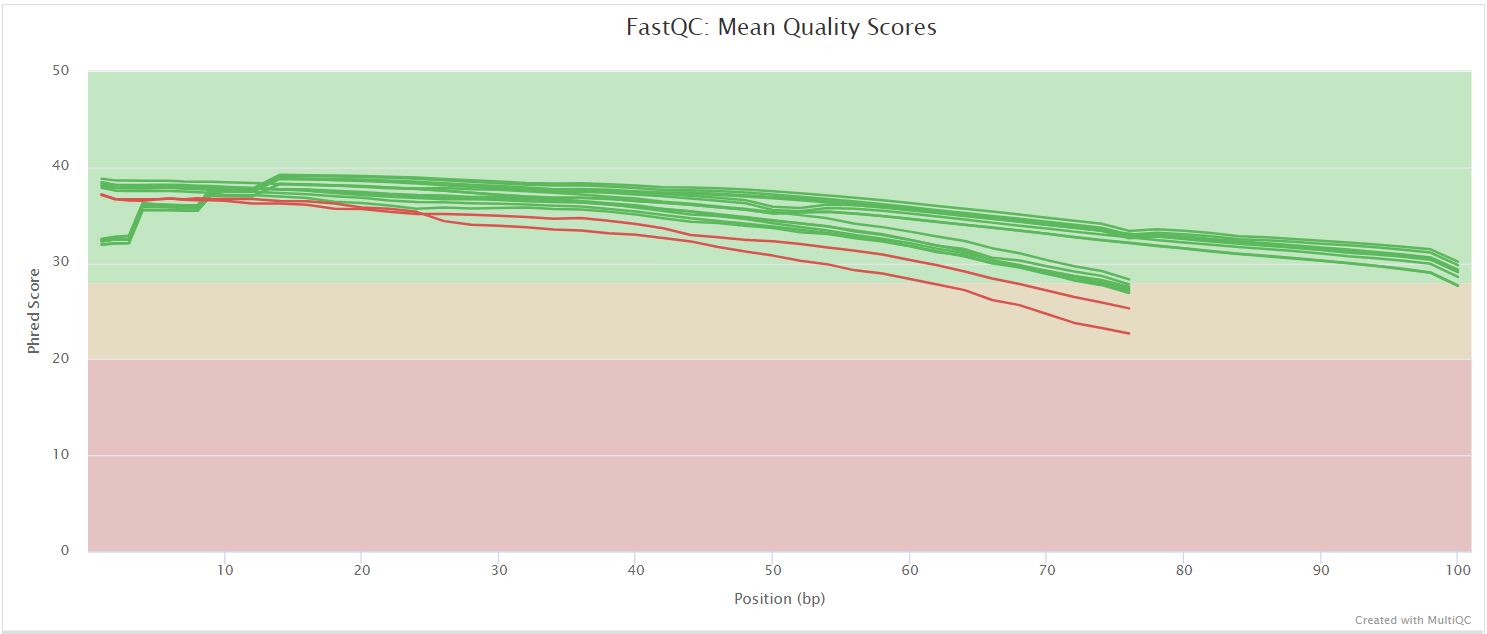
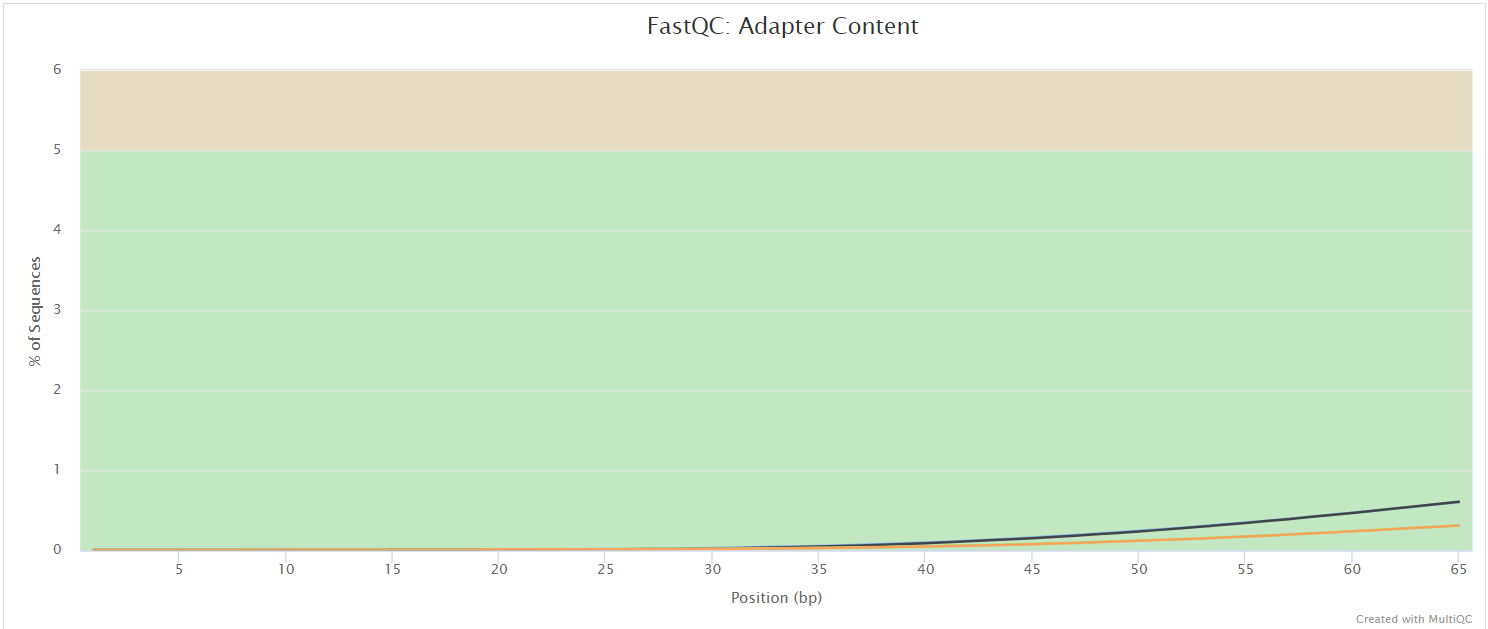
The FastQC plots displayed in the MultiQC report shows untrimmed reads. They may contain adapter sequence and potentially regions with low quality.
TrimGalore
Output files
trimgalore/*.fq.gz: If--save_trimmedis specified, FastQ files after adapter trimming will be placed in this directory.*_trimming_report.txt: Log file generated by Trim Galore!.
trimgalore/fastqc/*_fastqc.html: FastQC report containing quality metrics for read 1 (and read2 if paired-end) after adapter trimming.*_fastqc.zip: Zip archive containing the FastQC report, tab-delimited data file and plot images.
Trim Galore! is a wrapper tool around Cutadapt and FastQC to peform quality and adapter trimming on FastQ files. Trim Galore! will automatically detect and trim the appropriate adapter sequence. It is the default trimming tool used by this pipeline, however you can use fastp instead by specifying the --trimmer fastp parameter. You can specify additional options for Trim Galore! via the --extra_trimgalore_args parameters.
NB: TrimGalore! will only run using multiple cores if you are able to use more than > 5 and > 6 CPUs for single- and paired-end data, respectively. The total cores available to TrimGalore! will also be capped at 4 (7 and 8 CPUs in total for single- and paired-end data, respectively) because there is no longer a run-time benefit. See release notes and discussion whilst adding this logic to the nf-core/atacseq pipeline.

Alignment and quantification
STAR and Salmon
Output files
star_salmon/*.Aligned.out.bam: If--save_align_intermedsis specified the original BAM file containing read alignments to the reference genome will be placed in this directory.*.Aligned.toTranscriptome.out.bam: If--save_align_intermedsis specified the original BAM file containing read alignments to the transcriptome will be placed in this directory.
star_salmon/log/*.SJ.out.tab: File containing filtered splice junctions detected after mapping the reads.*.Log.final.out: STAR alignment report containing the mapping results summary.*.Log.outand*.Log.progress.out: STAR log files containing detailed information about the run. Typically only useful for debugging purposes.
star_salmon/unmapped/*.fastq.gz: If--save_unalignedis specified, FastQ files containing unmapped reads will be placed in this directory.
STAR is a read aligner designed for splice aware mapping typical of RNA sequencing data. STAR stands for Spliced Transcripts Alignment to a Reference, and has been shown to have high accuracy and outperforms other aligners by more than a factor of 50 in mapping speed, but it is memory intensive. Using --aligner star_salmon is the default alignment and quantification option.
Salmon from Ocean Genomics is a tool for wicked-fast transcript quantification from RNA-seq data. It requires a set of target transcripts (either from a reference or de-novo assembly) in order to perform quantification. All you need to run Salmon is a FASTA file containing your reference transcripts and a set of FASTA/FASTQ/BAM file(s) containing your reads. The transcriptome-level BAM files generated by STAR are provided to Salmon for downstream quantification. You can of course also provide FASTQ files directly as input to Salmon in order to pseudo-align and quantify your data by providing the --pseudo_aligner salmon parameter. The results generated by the pipeline are exactly the same whether you provide BAM or FASTQ input so please see the Salmon results section for more details.
The STAR section of the MultiQC report shows a bar plot with alignment rates: good samples should have most reads as Uniquely mapped and few Unmapped reads.

featureCounts
Output files
subread/featurecounts/*featureCounts.txt: Counts of reads mapping to features.*featureCounts.txt.summary: Summary log file for MultiQC.
This workflow uses featureCounts following STAR alignment if users choose edgeR for differential exon usage with the --aligner star or --aligner star_salmon and --edger_exon parameters. featureCounts from the Subread package is a quantification tool used to summarise reads over genomic features. In this case we count the number of reads overlapping each exon for each each gene before using edgeR for differential exon usage.
DEXSeq Count (HTSeq)
Output files
dexseq_exon/counts/*.clean.count.txt: Counts of reads mapping to features.
This workflow uses DEXSeq count which under the hood uses some functionality from HTSeq following STAR alignment if users choose DEXSeq Exon for differential exon usage with the --aligner star or --aligner star_salmon and --dexseq_exon parameters. DEXSeq count is a python script shipped with the DEXSeq package which uses parts of the HTSeq Python package functionality to count the number of reads which overlap with exon counting bins.
Alignment post-processing
The pipeline has been written in a way where all the files generated downstream of the alignment are placed in the same directory as specified by --aligner e.g. if --aligner star_salmon is specified then all the downstream results will be placed in the star_salmon/ directory. If --aligner star is specified then all the downstream results will be placed in the star directory. And if --pseudo-aligner salmon is provided all tools downstream of Salmon will be placed in the salmon directory. This means that results won’t be overwritten if portions of the pipeline are specified which duplicate downstream analysis (e.g. if --aligner star_salmon and --pseudo-aligner salmon are both specified). The pipeline can therefore be used for benchmarking between alignment algorithms if required.
SAMtools
Output files
<ALIGNER>/<SAMPLE>.sorted.bam: If--save_align_intermedsis specified the original coordinate sorted BAM file containing read alignments will be placed in this directory.<SAMPLE>.sorted.bam.bai: If--save_align_intermedsis specified the BAI index file for the original coordinate sorted BAM file will be placed in this directory.<SAMPLE>.sorted.bam.csi: If--save_align_intermeds --bam_csi_indexis specified the CSI index file for the original coordinate sorted BAM file will be placed in this directory.
<ALIGNER>/samtools_stats/- SAMtools
<SAMPLE>.sorted.bam.flagstat,<SAMPLE>.sorted.bam.idxstatsand<SAMPLE>.sorted.bam.statsfiles generated from the alignment files.
- SAMtools
The original BAM files generated by the selected alignment algorithm are further processed with SAMtools to sort them by coordinate, for indexing, as well as to generate read mapping statistics.


Other steps
MISO
Output files
misopy/index/: Directory containing MISO index files.miso_data/: Directory containing MISO data files.sashimi/: Directory containing Sashimi plots.
MISO (Mixture-of-Isoforms) is a probabilistic framework that quantitates the expression level of alternatively spliced genes from RNA-Seq data, and identifies differentially regulated isoforms or exons across samples. MISO comes with a built-in utility, sashimi_plot, for visualizing its output and for plotting raw RNA-Seq read densities along exons and junctions.
BEDTools and bedGraphToBigWig
Output files
<ALIGNER>/bigwig/*.forward.bigWig: bigWig coverage file relative to genes on the forward DNA strand.*.reverse.bigWig: bigWig coverage file relative to genes on the reverse DNA strand.
The bigWig format is an indexed binary format useful for displaying dense, continuous data in Genome Browsers such as the UCSC and IGV. This mitigates the need to load the much larger BAM files for data visualisation purposes which will be slower and result in memory issues. The bigWig format is also supported by various bioinformatics software for downstream processing such as meta-profile plotting.
Quality control
featureCounts
Output files
<ALIGNER>/featurecounts/*.featureCounts.txt: featureCounts biotype-level quantification results for each sample.*.featureCounts.txt.summary: featureCounts summary file containing overall statistics about the counts.*_mqc.tsv: MultiQC custom content files used to plot biotypes in report.
featureCounts from the Subread package is a quantification tool used to summarise the mapped read distribution over genomic features such as genes, exons, promotors, gene bodies, genomic bins and chromosomal locations. We can also use featureCounts to count overlaps with different classes of genomic features. This provides an additional QC to check which features are most abundant in the sample, and to highlight potential problems such as rRNA contamination.

MultiQC
Output files
multiqc/multiqc_report.html: a standalone HTML file that can be viewed in your web browser.multiqc_data/: directory containing parsed statistics from the different tools used in the pipeline.multiqc_plots/: directory containing static images from the report in various formats.
MultiQC is a visualization tool that generates a single HTML report summarising all samples in your project. Most of the pipeline QC results are visualised in the report and further statistics are available in the report data directory.
Results generated by MultiQC collate pipeline QC from supported tools e.g. FastQC. The pipeline has special steps which also allow the software versions to be reported in the MultiQC output for future traceability. For more information about how to use MultiQC reports, see http://multiqc.info.
Pseudo-alignment and quantification
Salmon
Output files
salmon/tximport/salmon.merged.gene_counts.tsv: Matrix of gene-level raw counts across all samples.salmon.merged.gene_tpm.tsv: Matrix of gene-level TPM values across all samples.salmon.merged.gene_counts_scaled.tsv: Matrix of gene-level scaled counts across all samples.salmon.merged.gene_counts_length_scaled.tsv: Matrix of gene-level length-scaled counts across all samples.salmon.merged.gene_tpm_scaled.tsv: Matrix of gene-level scaled TPM across all samples.salmon.merged.gene_tpm_length_scaled.tsv: Matrix of gene-level length-scaled TPM across all samples.salmon.merged.transcript_counts.tsv: Matrix of isoform-level raw counts across all samples.salmon.merged.transcript_tpm.tsv: Matrix of isoform-level TPM values across all samples.salmon.merged.transcript_counts_scaled.tsv: Matrix of isoform-level scaled raw counts across all samples.salmon.merged.transcript_counts_length_scaled.tsv: Matrix of isoform-level length-scaled raw counts across all samples.salmon.merged.transcript_counts_dtu_scaled.tsv: Matrix of isoform-level dtu scaled raw counts across all samples.salmon.merged.transcript_tpm_scaled.tsv: Matrix of isoform-level scaled TPM values across all samples.salmon.merged.transcript_tpm_length_scaled.tsv: Matrix of isoform-level length-scaled TPM values across all samples.salmon.merged.transcript_tpm_dtu_scaled.tsv: Matrix of isoform-level dtu scaled TPM values across all samples.salmon.merged.gi.rds: Tximport R object following tximport::summarizeToGene with countsFromAbundance = “no”salmon.merged.gi.s.rds: Tximport R object following tximport::summarizeToGene with countsFromAbundance = “scaledTPM”salmon.merged.gi.ls.rds: Tximport R object following tximport::summarizeToGene with countsFromAbundance = “lengthScaledTPM”salmon.merged.txi.rds: Tximport R object following tximport::tximport with countsFromAbundance = “no”salmon.merged.txi.s.rds: Tximport R object following tximport::tximport with countsFromAbundance = “scaledTPM”salmon.merged.txi.ls.rds: Tximport R object following tximport::tximport with countsFromAbundance = “lengthScaledTPM”salmon.merged.txi.dtu.rds: Tximport R object following tximport::tximport with countsFromAbundance = “dtuScaledTPM”tximport.tx2gene.tsv: Filtered Tab-delimited file containing gene to transcripts ids mappings.suppa_tpm.txt: Tab-delimited file containing TPM normalised counts formatted for SUPPA downstream analysis
salmon/<SAMPLE>/aux_info/: Auxiliary info e.g. versions and number of mapped reads.cmd_info.json: Information about the Salmon quantification command, version and options.lib_format_counts.json: Number of fragments assigned, unassigned and incompatible.libParams/: Contains the fileflenDist.txtfor the fragment length distribution.logs/: Contains the filesalmon_quant.loggiving a record of Salmon’s quantification.quant.genes.sf: Salmon gene-level quantification of the sample, including feature length, effective length, TPM, and number of reads.quant.sf: Salmon transcript-level quantification of the sample, including feature length, effective length, TPM, and number of reads.
As described in the STAR and Salmon section, you can choose to pseudo-align and quantify your data with Salmon by providing the --pseudo_aligner salmon parameter.
To summarise Salmon results and produce gene and transcript level counts and normalised (TPM) values we use the tximport R package. Like the nf-core/rnaseq pipeline this workflow produces counts, as well as TPM normalised values at gene and transcript level, however it also provides scaled, length-scaled, and dtu-scaled values which may be used for downstream splicing analysis. In particular, scaled, and dtu-scaled TPMs (see the --dtu_txi dtuScaledTPM or --dtu_txi scaledTPM parameter) can be chosen by users for DTU analysis with DRIMSeq filtering and DEXSeq as seen in this workflow. These files can be accessed as TSVs or as their original R object for ease of use with additional downstream R analysis.
Although this workflow does not deal in differential gene expression we also produce gene level summarisations in TSV format, as well as R objects following tximport::summarizeToGene if users wish to progress to differential gene expression independently. Furthermore, the pipeline will produce a tximport.tx2gene.tsv file which has been filtered and matched with the incoming Salmon quant.sf files which can be used for any additional downstream analysis.
This workflow will also produce a suppa_tpm.txt which is a tab delimitated text file of TPM normalised counts formatted for SUPPA analysis.
NB: As described by the nf-core/rnaseq pipeline: “The default Salmon parameters and a k-mer size of 31 are used to create the index. As documented here and discussed here, a k-mer size off 31 works well with reads that are 75bp or longer”.
NB: As described by the nf-core/rnaseq pipeline: “Transcripts with large inferential uncertainty won’t be assigned the exact number of reads reproducibly, every time Salmon is run. Read more about this on the nf-core/rnaseq and salmon Github repos”.
Differential Exon Usage (DEU)
DEXSeq
Output files
dexseq_exon/results/DEXSeqDataSet.{contrast}.rds: DEXSeqDataSet R object.DEXSeqResults.{contrast}.rds: DEXSeqResults R object following DEXSeq::DEXSeqResults containing results.DEXSeqResults.{contrast}.csv: CSV results table of DEXSeq DEU analysis featuring log2foldchanges and p-values etc.perGeneQValue.{contrast}.rds: DEXSeq R Object following DEXSeq::perGeneQValue containing q-values per gene.perGeneQValue.{contrast}.csv: CSV file of q-values for perGeneQValue.*.rds R Object.plotDEXSeq.{contrast}.pdf: PDF file of top N genes from DEXSeq results.
dexseq_exon/annotation/DEXSeq.gff: GFF file used for DEXSeq DEU analysis converted from GTF input.
dexseq_exon/counts/*.clean.count.txt: Counts of reads mapping to features. (See DEXSeq Count (HTSeq) section above)
DEXSeq is used to find differential exon usage. For each gene, DEXSeq fits a generalized linear model with the formula ~sample + exon + condition:exon and compares it to the smaller null model ~ sample + exon and this pipeline utilises these models as default. The DEXSeqDataSet.{contrast}.rds is a DEXSeqDataSet R object which contains slots with information regarding the tests DEXSeq performs internally for differential exon usage using these models. Please see this for further details. The DEXSeqDataSet.{contrast}.rds output is a DEXSeqResults R object which summarize the full results contained within the DEXSeqDataSet object. The DEXSeqResults.{contrast}.csv output is the DEXSeqResults.{contrast}.rds object saved out in CSV format for ease of access. It is also sometimes useful to understand what the FDR is at the gene level as DEXSeqResults.{contrast}.csv and DEXSeqDataSet.{contrast}.rds results output only contain p-values and q-values on a per-exon level. Situations where this may be useful are when you may need to know the number of genes with at least one differentially used exon whilst controlling for FDR. Please see this for further details regarding controlling FDR at the gene level. Users can therefore download perGeneQValue.{contrast}.rds which is an R object of gene level q-values - aggregating evidence from multiple tests to a gene level. perGeneQValue.{contrast}.csv is this same perGeneQValue.{contrast}.rds object in CSV format.
Users may also wish to inspect the GFF file that DEXSeq creates prior to running DEXSeq count. This is completed using a python script which is shipped with DEXSeq. This GFF file DEXSeq.gff is saved with the dexseq_exon/annotation/ folder.
Finally, as discussed above in the DEXSeq count section, users can inspect counts of reads mapping to features within the dexseq_exon/counts/ folder used downstream as input to DEXSeq.
edgeR
Output files
edger/DGEList.rds: DGEList R object following filtering, normalisation, and dispersion estimation.DGEGLM.rds: DGEGLM R object following edgeR::glmQLFitDGELRT.exprs.rds: DGELRT R object following differential exon expression analysis with edgeR::glmQLFTestDGELRT.usage.rds: DGELRT R object following differential exon usage analysis with edgeR::diffSpliceDGE{contrast}.usage.usage.csv: CSV file output of differential exon usage results per pairwise condition for top spliced results at the exon level.{contrast}.usage.gene.csv: CSV file output of differential exon usage results per pairwise condition for top spliced genes identified with F-tests.{contrast}.usage.simes.csv: CSV file output of differential exon usage results per pairwise condition for top spliced genes identified with the Simes method.{contrast}.exprs.csv: CSV file output of differential exon expression results per pairwise condition.
edgeR is a bioconductor R package typically used for differential gene expression, however, it contains numerous additional functions which make it useful for splicing analysis. In particular, edgeR can perform differential exon usage analysis, and we leverage this functionality here. As output users can retrieve DGEList.rds, and DGEGLM.rds R objects which contain the first steps of the edgeR analysis. Users can also find DGELRT.exprs.rds and DGELRT.usage.rds R objects which provide R objects following differential exon expression and differential exon usage steps respectively. Results CSV files are also output per comparison as {contrast}.usage.usage.csv which contain the differential exon usage results, {contrast}.usage.gene.csv which contain results at a gene level identified with F-tests, and {contrast}.usage.simes.csv which contain results at a gene level using the Simes adjustment.
It was felt that users may wish to retrieve differential exon results at this point on top of differential exon usage results as edgeR is able to calculate them without difficulty. By default, this workflow will calculate all possible pairwise comparisons between conditions.
Differential Transcript Usage (DTU)
DRIMSeq
Output files
salmon/dexseq_dtu/filter/drimseq/dmDSdata.rds: A DRIMSeq R Object containing filtered normalised counts table used as input for DEXSeq analysis.
DRIMSeq is a standalone DTU analysis tool, however, we only use it as a filtering step within this workflow. It initially takes as input counts table from tximport, and returns a DRIMSeq R Object (following DRIMSeq::dmFilter function) containing filtered normalised counts table used as input for DEXSeq analysis.
DEXSeq
Output files
salmon/dexseq_dtu/results/dexseq/DEXSeqDataSet.{contrast}.rds: DEXSeqDataSet R object.DEXSeqResults.{contrast}.rds: DEXSeqResults R object following DEXSeq::DEXSeqResults containing results.DEXSeqResults.{contrast}.tsv: TSV results table of DEXSeq DEU analysis featuring log2foldchanges and p-values etc.perGeneQValue.{contrast}.rds: DEXSeq R Object following DEXSeq::perGeneQValue containing q-values per gene.perGeneQValue.{contrast}.tsv: TSV file of q-values for qval_exon.rds R Object.
stager/stageRTx.{contrast}.rds: stageRTx R object.getAdjustedPValues.{contrast}.rds: R object following stageR::getAdjustedPValues - transcript and gene level adjusted p-values.getAdjustedPValues.{contrast}.tsv: TSV with transcript and gene level adjusted p-values.
DEXSeq. As described above in the DEU section, DEXSeq is a tool created for differential exon usage. However, it can also be run on estimated transcript counts for differential transcript usage. This pipeline follows the following workflow which you can read for more details. As in the DEU DEXSeq we utilise the following default models: ~sample + exon + condition:exon comparing to the smaller null model ~ sample + exon. We use the word exon here as DEXSeq was designed originally for DEU, however users can read this instead as transcript for this DTU analysis.
The DEXSeqDataSet.*.rds is a DEXSeqDataSet R object which contains slots with information regarding the tests DEXSeq performs internally for differential transcript usage using these models. The DEXSeqResults.{contrast}.rds output is a DEXSeqResults R object which summarize the full results contained within the DEXSeqDataSet object. The DEXSeqResults.{contrast}.tsv output is the DEXSeqResults.{contrast}.rds object saved out in TSV format for ease of access. It is also sometimes useful to understand what the FDR is at the gene level as DEXSeqResults.{contrast}.tsv and DEXSeqResults.{contrast}.rds results output only contain p-values and q-values on a per-transcript level. Users can therefore download perGeneQValue.{contrast}.rds which is an R object of gene level q-values - aggregating evidence from multiple tests to a gene level. perGeneQValue.{contrast}.tsv is this same perGeneQValue.{contrast}.rds object in TSV format.
Finally, this portion of the pipeline will run stageR, a tool for stage wise analysis of high throughput expression data, following DEXSeq. This allows us to answer a two stage set of questions - the first is “Which set of genes show some evidence of DTU?” which we ask by running the DEXSeq screening step and the second “Which transcripts in those identified genes participate in DTU?” a secondary confirmation step. Outputs for stageR include stageRTx.{contrast}.rds an stageRTx R object which has p-value correction with stageWiseAdjustment with 5% target Overall FDR (alpha=0.05) and method=“dtu” as default. The getAdjustedPValues.{contrast}.rds is an R object of results - a matrix with transcript and gene level adjusted p-values with gene and respective transcript level gene identifiers in the first two columns. getAdjustedPValues.{contrast}.tsv is a TSV file identical to getAdjustedPValues.{contrast}.rds. Finally, getAdjustedPValues.{contrast}.tsv, is the results from getAdjustedPValues.{contrast}.rds combined with the results from DEXSeq DEXSeqResults.{contrast}.tsv.
Event-based analysis
rMATS
Output files
rmats/{contrast}/rmats_temp/*: Folder containing .txt and .rmats files which are input for rmats_post step.{contrast}/rmats_prep.log: Log file generated for rmats_prep step.{contrast}/rmats_post/*: Folder containing results of differential alternative splicing in .txt files.{contrast}/rmats_post.log: Log file generated for rmats_post step.
rMATS is a tool which runs differential alternative splicing analysis on RNA-seq data. We implement the tool from BAM files after STAR alignment. Further details regarding rMATS output can be found here, and these files are saved within the rmats_post/ folder.
SUPPA2
Output files
salmon/suppa/generate_events/per_isoform/orgenerate_events/per_local_event/events.*: Shows the relationship between each event and the transcripts that define that particular event.events_*.*: Shows the relationship between each individual event type and the transcripts that define that particular event.
psi_per_isoform/suppa_isoform.psi: Contains relative abundance value per sample for transcript isoforms.
psi_per_local_event/suppa_local.psi: Contains relative abundance value per sample for local events.
split_files/per_isoform/orsplit_files/per_local_event/-*.psi: Contains relative abundance value per sample for each event (split by condition)split_files/tpms/*.tpm: Contains normalised TPM per sample (split by condition)
diffsplice/per_isoform/ordiffsplice/per_local_event/{contrast}_*_diffsplice.dpsi: Contains the information about which events are significantly differentially spliced in each pairwise comparison.{contrast}_*_diffsplice.psivec: Contains the PSI values for all samples, either per replicate or the average PSI value per condition, averaging over the replicates.
clusterevents/per_isoform/orclusterevents/per_local_event/{contrast}_*_cluster.clustvec: Contains the events, their mean psi values per condition, and the clusters association. If an event has no associated cluster, it will be assigned to -1.{contrast}_*_cluster_scores.log: Containing information of the clusters found.
SUPPA2 is a tool for studying splicing events at a local and transcript level. There are numerous outputs for SUPPA and these will be saved in the folder of the aligner or pseudo aligner setting used. If --pseudo_aligner salmon is used they will be saved in the salmon/suppa/ folder and if --aligner star_salmon has been used they will be saved in the star_salmon/suppa/ folder. The subsequent results are separated into folders depending on the stage and type of analysis. events.* output is saved within the generate_events/ folder under per_isoform/ or per_local_event/ depending on the type of analysis (transcript level or local). PSI values suppa_isoform.psi and suppa_local.psi are saved within psi_per_isoform/ and psi_per_local_event/ respectively. For more details on PSI calculation please see the SUPPA documentation. Split files used for differential splicing analysis (PSI and TPM files split by condition), can also be accessed as output in the following folders - split_files/per_isoform/ or split_files/per_local_event/ and split_files/tpms/. Output from differential splicing analysis at a transcript isoform and local level can also be accessed (*.dpsi, *.psivec) within diffsplice/per_isoform/ and diffsplice/per_local_event/ respectively. Finally, clustering analysis output (*.clustvec, *.log) can be accessed within clusterevents/per_isoform/ or clusterevents/per_local_event/ folders.
Workflow reporting and genomes
Reference genome files
Output files
genome/*.fa,*.gtf,*.gff: If the--save_referenceparameter is provided then all of the genome reference files will be placed in this directory.
genome/index/star/: Directory containing STAR indices.salmon/: Directory containing Salmon indices.
A number of genome-specific files are generated by the pipeline because they are required for the downstream processing of the results. If the --save_reference parameter is provided then these will be saved in the genome/ directory. It is recommended to use the --save_reference parameter if you are using the pipeline to build new indices so that you can save them somewhere locally. The index building step can be quite a time-consuming process and it permits their reuse for future runs of the pipeline to save disk space.
Pipeline information
Output files
pipeline_info/- Reports generated by Nextflow:
execution_report.html,execution_timeline.html,execution_trace.txtandpipeline_dag.dot/pipeline_dag.svg. - Reports generated by the pipeline:
pipeline_report.html,pipeline_report.txtandsoftware_versions.yml. Thepipeline_report*files will only be present if the--email/--email_on_failparameter’s are used when running the pipeline. - Reformatted samplesheet files used as input to the pipeline:
samplesheet.valid.csv. - Parameters used by the pipeline run:
params.json.
- Reports generated by Nextflow:
Nextflow provides excellent functionality for generating various reports relevant to the running and execution of the pipeline. This will allow you to troubleshoot errors with the running of the pipeline, and also provide you with other information such as launch commands, run times and resource usage.