1.1.0). The latest stable release is2.4.1.Introduction
nf-core/smrnaseq is a bioinformatics best-practice analysis pipeline used for small RNA sequencing data analysis.
This document describes the output produced by the pipeline. Most of the plots are taken from the MultiQC report, which summarises results at the end of the pipeline.
The directories listed below will be created in the results directory after the pipeline has finished. All paths are relative to the top-level results directory.
Pipeline overview
The pipeline is built using Nextflow and processes data using the following steps:
- FastQC - read quality control
- TrimGalore - adapter trimming
- Bowtie - alignment against mature miRNAs and miRNA precursors (hairpins)
- SAMtools - alignment result processing and feature counting
- edgeR - normalization, MDS plot and sample pairwise distance heatmap
- Bowtie - alignment against reference genome for QC purpose
- mirtop - miRNA and isomiR annotation
- miRDeep2 - known and novel miRNA annotation
- miRTrace - a comprehensive tool for QC purpose
- MultiQC - aggregate report, describing results of the whole pipeline
- Pipeline information - Report metrics generated during the workflow execution
FastQC
FastQC gives general quality metrics about your sequenced reads. It provides information about the quality score distribution across your reads, per base sequence content (%A/T/G/C), adapter contamination and overrepresented sequences.
For further reading and documentation see the FastQC help pages.
Output files:
fastqc/*_fastqc.html: FastQC report containing quality metrics for your untrimmed raw fastq files.
fastqc/zips/*_fastqc.zip: Zip archive containing the FastQC report, tab-delimited data file and plot images.
NB: The FastQC plots displayed in the MultiQC report shows untrimmed reads. They may contain adapter sequence and potentially regions with low quality.
TrimGalore
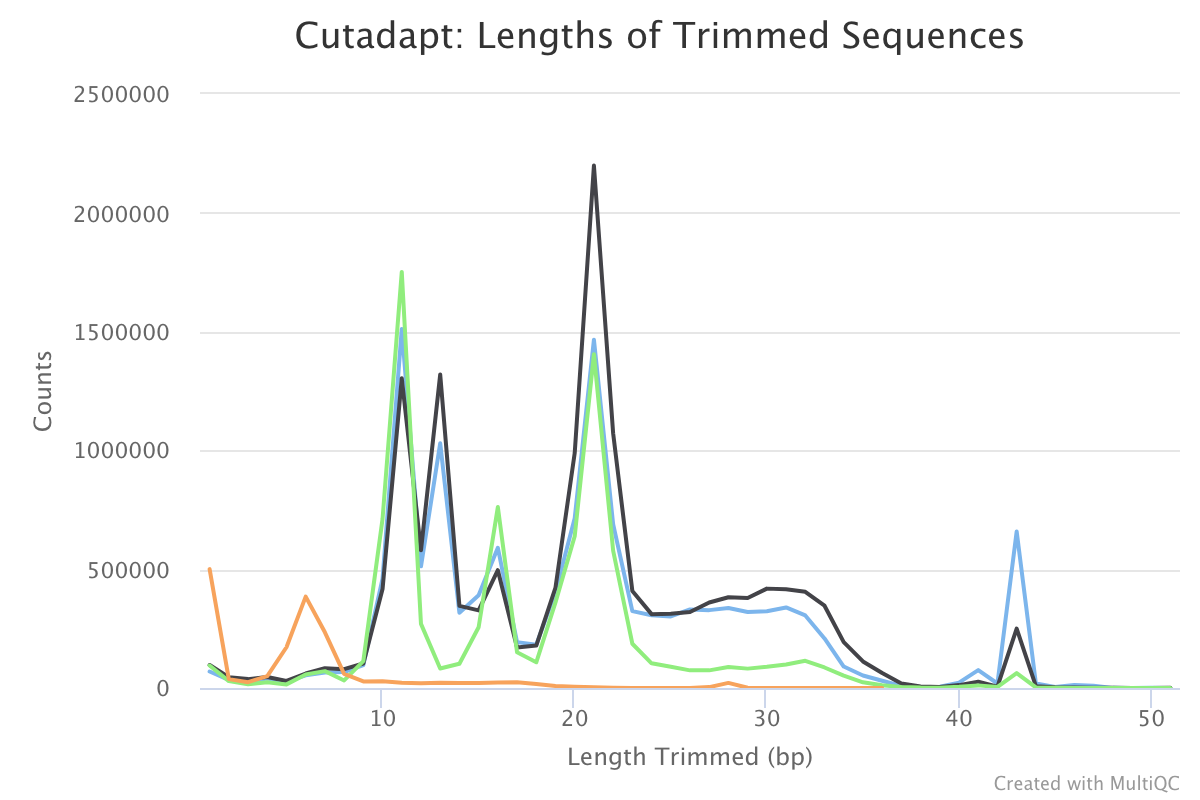
TrimGalore is used for removal of adapter contamination and trimming of low quality regions. TrimGalore uses Cutadapt for adapter trimming and runs FastQC after it finishes.
MultiQC reports the percentage of bases removed by TrimGalore in the General Statistics table, along with a line plot showing where reads were trimmed.
Output directory: results/trim_galore
Contains FastQ files with quality and adapter trimmed reads for each sample, along with a log file describing the trimming.
sample_trimmed.fq.gz- Trimmed FastQ data
sample.fastq.gz_trimming_report.txt- Trimming report (describes which parameters that were used)
sample_trimmed_fastqc.htmlsample_trimmed_fastqc.zip- FastQC report for trimmed reads
This is an example of the output we can get:
Bowtie - miRNAs
Bowtie is used for mapping adapter trimmed reads against the mature miRNAs and miRNA precursors (hairpins) in miRBase.
Output directory: results/bowtie
miRBase_mature/sample.mature.bam- The aligned BAM file of alignment against mature miRNAs
miRBase_mature/sample.mature_unmapped.fq.gz- Unmapped reads against mature miRNAs This file will be used as input for the alignment against miRNA precursors (hairpins)
miRBase_hairpin/sample.hairpin.bam- The aligned BAM file of alignment against miRNA precursors (hairpins)
miRBase_hairpin/sample.hairpin_unmapped.fq.gz- Unmapped reads against miRNA precursors (hairpins)
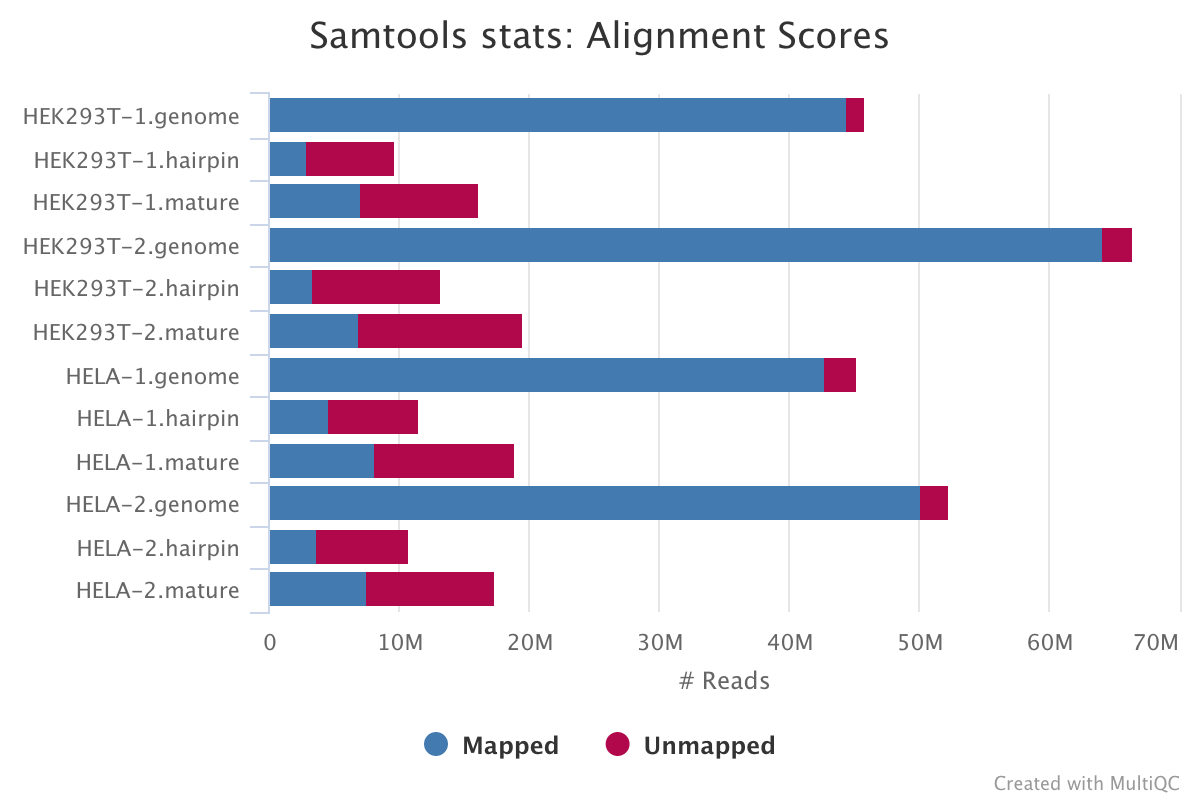
SAMtools
SAMtools is used for sorting and indexing the output BAM files from Bowtie. In addition, the numbers of features are counted with the idxstats option.
Output directory: results/bowtie
miRBase_mature/sample.mature.stats|idxstats|flagstat- Raw mapped read counts and stats of mature miRNAs
miRBase_mature/sample.mature.sorted.bam- The sorted BAM file of alignment against mature miRNAs
miRBase_mature/sample.mature.sorted.bam.bai- The index file of alignment against mature miRNAs
miRBase_hairpin/sample.hairpin.stats|idxstats|flagstat- Raw mapped read counts and stats of miRNA precursors (hairpins)
miRBase_hairpin/sample.hairpin.sorted.bam- The sorted BAM file of alignment against miRNA precursors (hairpins)
miRBase_hairpin/sample.hairpin.sorted.bam.bai- The index file of alignment against miRNA precursors (hairpins)
edgeR
edgeR is an R package used for differential expression analysis of RNA-seq expression profiles.
Output directory: results/edgeR
[mature/hairpin]_normalized_CPM.txt- TMM normalized counts of reads aligned to mature miRNAs/miRNA precursors (hairpins)
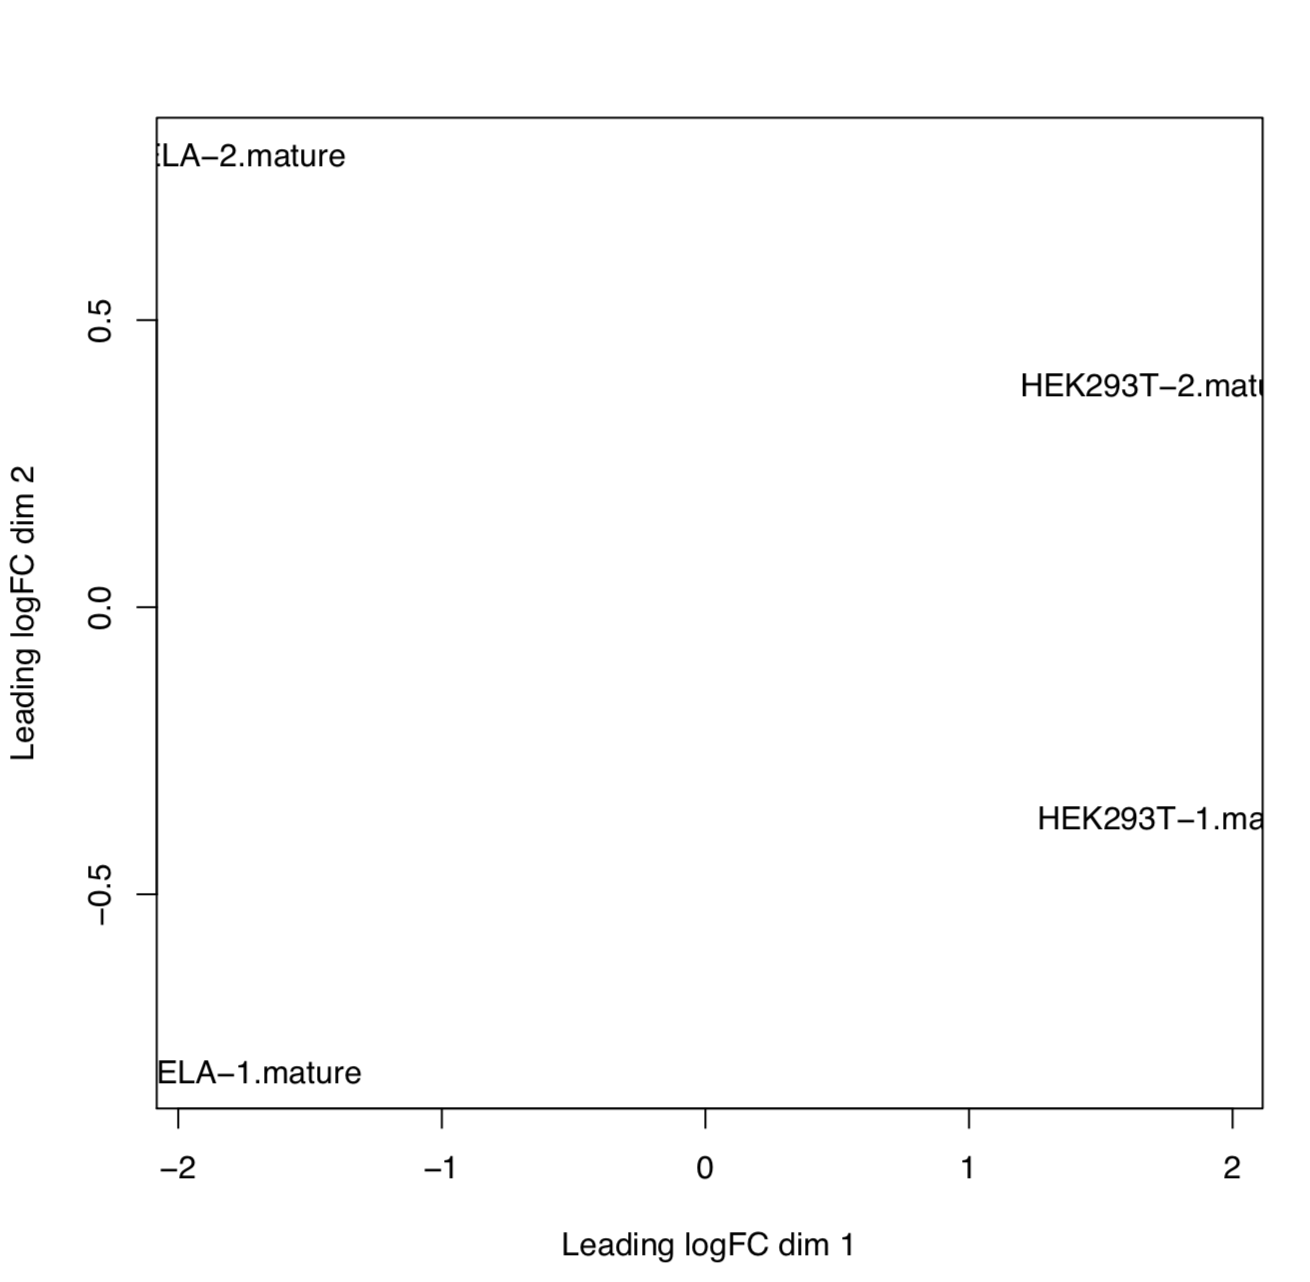
[mature/hairpin]_edgeR_MDS_plot.pdf- Multidimensional scaling plot of all samples based on the expression profile of mature miRNAs/miRNA precursors (hairpins)
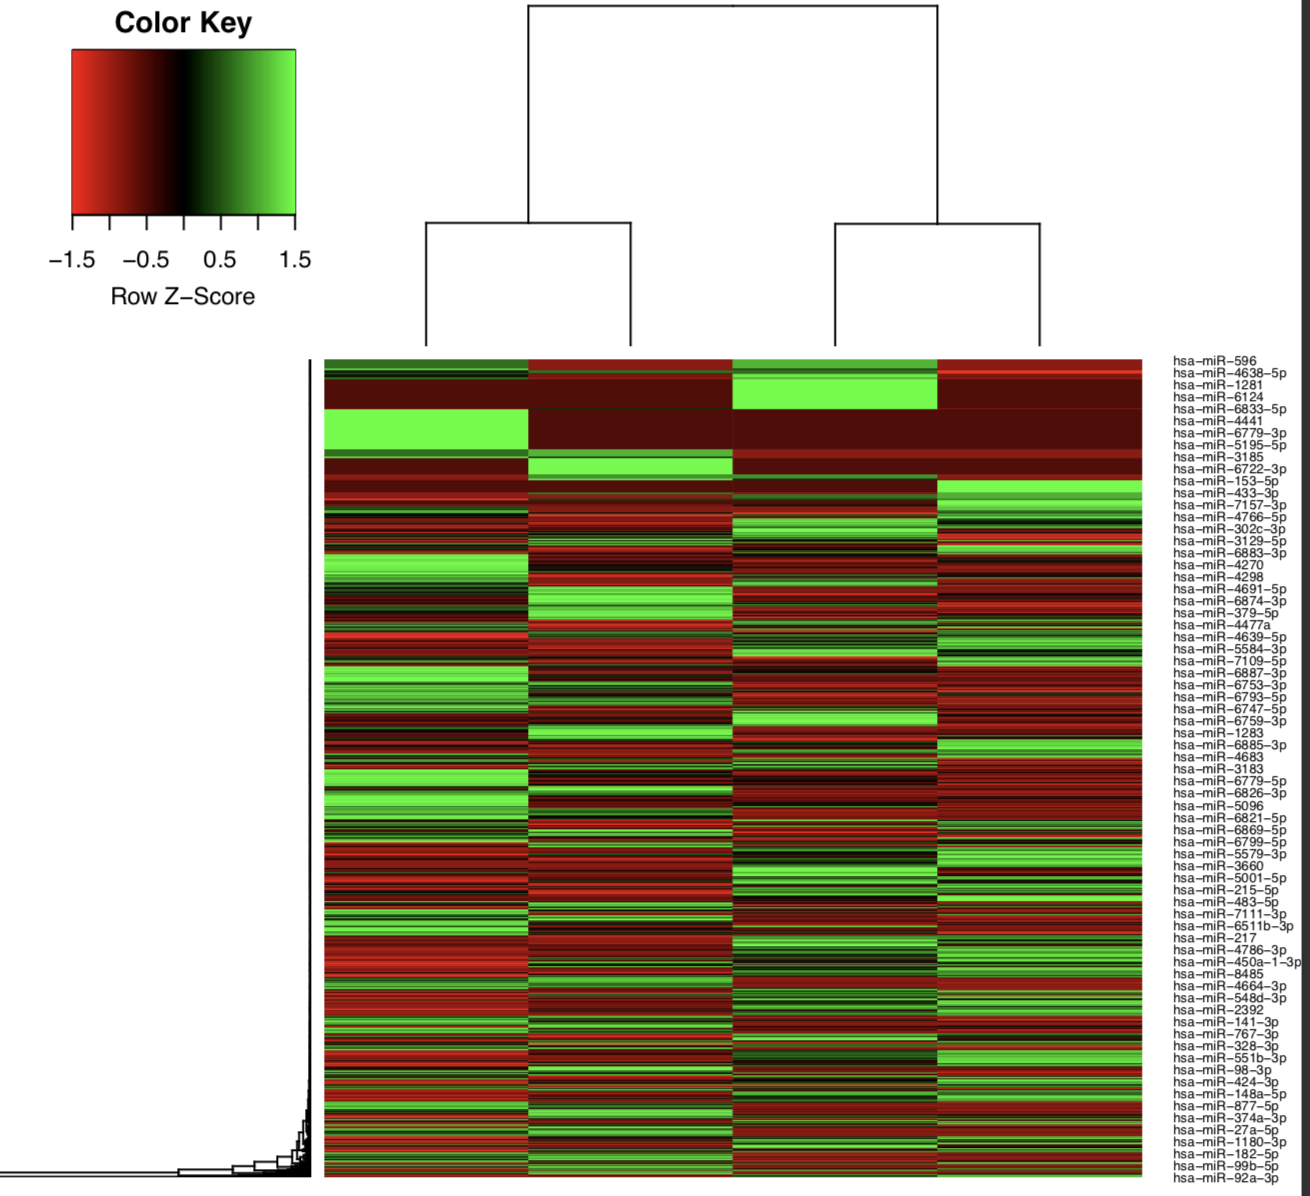
[mature/hairpin]_CPM_heatmap.pdf- Heatmap based on the expression profile of mature miRNAs/miRNA precursors (hairpins)
[mature/hairpin]_log2CPM_sample_distances_dendrogram.pdf- Dendrograms of distance among samples based on the expression profile of mature miRNAs/miRNA precursors (hairpins)
[mature/hairpin]_log2CPM_sample_distances_heatmap.pdf- Pairwise correlation of samples based on the expression profile of mature miRNAs/miRNA precursors (hairpins)
Example: MDS plot of 10 samples based on their expression profiles of mature miRNAs. Here we can see that samples cluster based on different sample types and library preparation kits.
Example: Heatmap of tumor and normal samples based on the top differentially expressed mature miRNAs.
Bowtie - QC
Bowtie is used for mapping adapter trimmed reads against the reference genome for quality control purposes.
Output directory: results/bowtie_ref
sample.genome.bam- The aligned BAM file against reference genome
sample.genome.stats|idxstats|flagstat- Raw mapped read counts and stats of mature miRNAs
mirtop
mirtop is used to parse the BAM files from bowtie alignment, and produce a mirgff3 file with information about miRNAs and isomirs.
Output directory: results/mirtop
mirtop.gff: mirgff3 filemirtop.tsv: tabular file of the previous file for easy integration with downstream analysis.mirtop_rawData.tsv: File compatible with isomiRs Bioconductor package to perform isomiRs analysis.mirna.tsv: tabular file with miRNA counts after summarizing unique isomiRs for each miRNA
miRDeep2
miRDeep2 is used for the identification of novel and known miRNAs in deep sequencing data.
Output directory: results/mirdeep2
mirdeep/timestamp_sample.bed- File with the known and novel miRNAs in bed format.
mirdeep/timestamp_sample.csv- File with an overview of all detected miRNAs (known and novel) in csv format.
mirdeep/timestamp_sample.html- A HTML report with an overview of all detected miRNAs (known and novel) in html format.
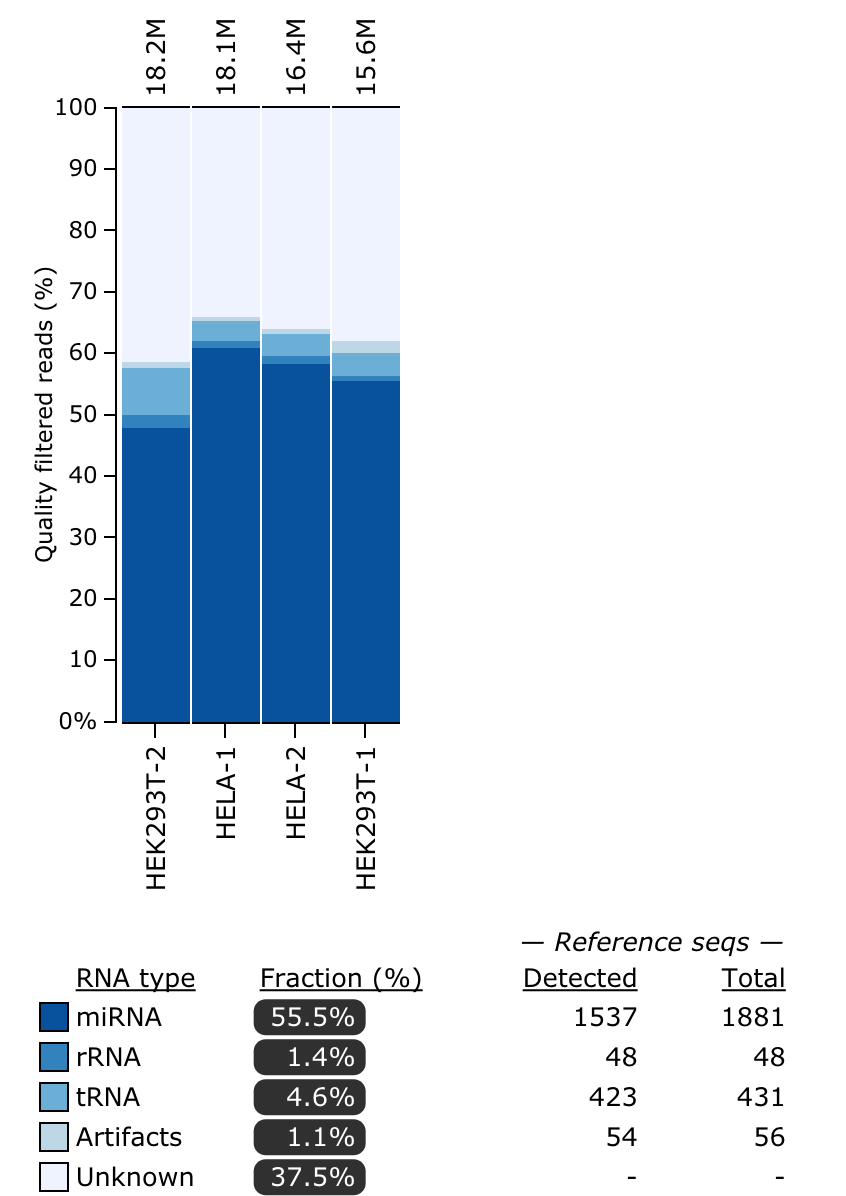
miRTrace
miRTrace is a quality control specifically for small RNA sequencing data (smRNA-Seq). Each sample is characterized by profiling sequencing quality, read length, sequencing depth and miRNA complexity and also the amounts of miRNAs versus undesirable sequences (derived from tRNAs, rRNAs and sequencing artifacts).
Output directory: results/miRTrace
mirtrace-report.html- An interactive HTML report summarizing all output statistics from miRTrace
mirtrace-results.json- A JSON file with all output statistics from miRTrace
mirtrace-stats-*.tsv- Tab-separated statistics files
qc_passed_reads.all.collapsed- FASTA file per sample with sequence reads that passed QC in miRTrace
qc_passed_reads.rnatype_unknown.collapsed- FASTA file per sample with unknown reads in the RNA type analysis
Refer to the tool manual for detailed specifications about output files. Here is an example of the RNA types plot that you will see:
MultiQC
MultiQC is a visualization tool that generates a single HTML report summarizing all samples in your project. Most of the pipeline QC results are visualised in the report and further statistics are available in the report data directory.
The pipeline has special steps which also allow the software versions to be reported in the MultiQC output for future traceability.
For more information about how to use MultiQC reports, see https://multiqc.info.
Output files:
multiqc/multiqc_report.html: a standalone HTML file that can be viewed in your web browser.multiqc_data/: directory containing parsed statistics from the different tools used in the pipeline.multiqc_plots/: directory containing static images from the report in various formats.
Pipeline information
Nextflow provides excellent functionality for generating various reports relevant to the running and execution of the pipeline. This will allow you to troubleshoot errors with the running of the pipeline, and also provide you with other information such as launch commands, run times and resource usage.
Output files:
pipeline_info/- Reports generated by Nextflow:
execution_report.html,execution_timeline.html,execution_trace.txtandpipeline_dag.dot/pipeline_dag.svg. - Reports generated by the pipeline:
pipeline_report.html,pipeline_report.txtandsoftware_versions.csv. - Documentation for interpretation of results in HTML format:
results_description.html.
- Reports generated by Nextflow: