Introduction
nf-core/smrnaseq is a bioinformatics best-practice analysis pipeline used for small RNA sequencing data analysis.
This document describes the output produced by the pipeline. Most of the plots are taken from the MultiQC report, which summarises results at the end of the pipeline.
The directories listed below will be created in the results directory after the pipeline has finished. All paths are relative to the top-level /results directory.
Pipeline overview
The pipeline is built using Nextflow and processes data using the following steps:
- Preprocessing - Preprocessing of reference files
- FastQC - read quality control
- UMI-tools extract - UMI barcode extraction
- UMI-collapse deduplicate - read deduplication
- FastP - adapter trimming
- Bowtie2 - contamination filtering
- Bowtie - alignment against mature miRNAs and miRNA precursors (hairpins)
- SAMtools - alignment result processing and feature counting
- edgeR - normalization, MDS plot and sample pairwise distance heatmap
- Bowtie - alignment against reference genome for QC purpose
- mirtop - miRNA and isomiR annotation
- miRDeep2 - known and novel miRNA annotation
- miRTrace - a comprehensive tool for QC purpose
- MultiQC - aggregate report, describing results of the whole pipeline
- Pipeline information - Report metrics generated during the workflow execution
If --save_intermediates is specified, intermediate files generated by each process will be saved in the output directory.
Preprocessing
Output files
bowtie_index/genome: Cleaned genome.fa fasta.untar/bowtie_index: Uncompressed bowtie index file.
Preprocessing is done to format reference files before using them in the workflow, it includes untar and bioawk. If the bowtie_index file provided is in gzip format it will be processed by untar. The fasta file provided will be cleaned using bioawk.
FastQC
Output files
fastqc/*_fastqc.html: FastQC report containing quality metrics.*_fastqc.zip: Zip archive containing the FastQC report, tab-delimited data file and plot images.
FastQC gives general quality metrics about your sequenced reads. It provides information about the quality score distribution across your reads, per base sequence content (%A/T/G/C), adapter contamination and overrepresented sequences. For further reading and documentation see the FastQC help pages.

UMI-tools extract
Output files
umi_dedup/fastq_extracted_umi/*.fastq.gz: If--save_umi_intermedsis specified, FastQ files after UMI extraction will be placed in this directory.*.log: Log file generated by the UMI-toolsextractcommand.
UMI-tools extracts UMIs from reads based on unique molecular identifiers (UMIs) to address PCR-bias. Firstly, the UMI-tools extract command removes the UMI barcode information from the read sequence and adds it to the read name. Secondly, reads are deduplicated based on UMI identifier after mapping as highlighted in the UMI-collapse deduplicate section.
To facilitate processing of input data which has the UMI barcode already embedded in the read name from the start, --skip_umi_extract can be specified in conjunction with --with_umi.
FastP
FastP is used for removal of adapter contamination and trimming of low-quality regions.
MultiQC reports the percentage of bases removed by FastP in the General Statistics table, along some further information on the results.
Output directory: results/fastp
Contains FastQ files with quality and adapter-trimmed reads for each sample, along with a log file describing the trimming.
sample_fastp.json- JSON report file with information on parameters and trimming metricssample_fastp.html- HTML report with some visualizations of trimming metrics
FastP can automatically detect adapter sequences when not specified directly by the user - the pipeline also comes with a feature and a supplied miRNA adapters file to ensure adapters auto-detected are more accurate. If there are needs to add more known miRNA adapters to this list, please open a pull request.
UMI-collapse deduplicate
Output files
umi_dedup/bam_deduplicated*.fastq.gz: If--save_umi_intermedsis specified, the deduplicated fastq.gz files after UMI deduplication will be placed in this directory.
UMI-tools deduplicates reads based on unique molecular identifiers (UMIs) to address PCR-bias. Firstly, the UMI-tools extract command removes the UMI barcode information from the read sequence and adds it to the read name as highlighted in the UMI-tools extract section. Umicollapse works directly on the fastq files instead of mapping the UMI data first, then deduplicating and generating fastq files again.
Bowtie2
Bowtie2 is used to align the reads to user-defined databases and to build indexes for --filter_contaminant files.
MultiQC reports the number of reads that were removed by each of the contaminant databases.
Bowtie
Bowtie is used for building the index for the fasta genome, if needed. It is also used for mapping adapter trimmed reads against the mature miRNAs and miRNA precursors (hairpins) of the chosen database miRBase or MirGeneDB.
Output directory: results/
bowtie_index/mirna_hairpin/bowtie: hairpin.fa bowtie index files.mirna_mature/bowtie: mature.fa bowtie index files.
genome_quant/genome_quant/bam/.*bam: The aligned BAM file results.genome_quant/bam/.*unmapped.fastq.gz: Unmapped reads results.
mirna_quant/mirna_quant/bam/{hairpin,mature,seqcluster}/.*bam: The aligned BAM file results against hairpin, mature or seqcluster.mirna_quant/bam/{hairpin,mature,seqcluster}/.*unmapped.fastq.gz: Unmapped reads for hairpin, mature or seqcluster.
If --save_intermediates is specified, these files will be placed in this directory.
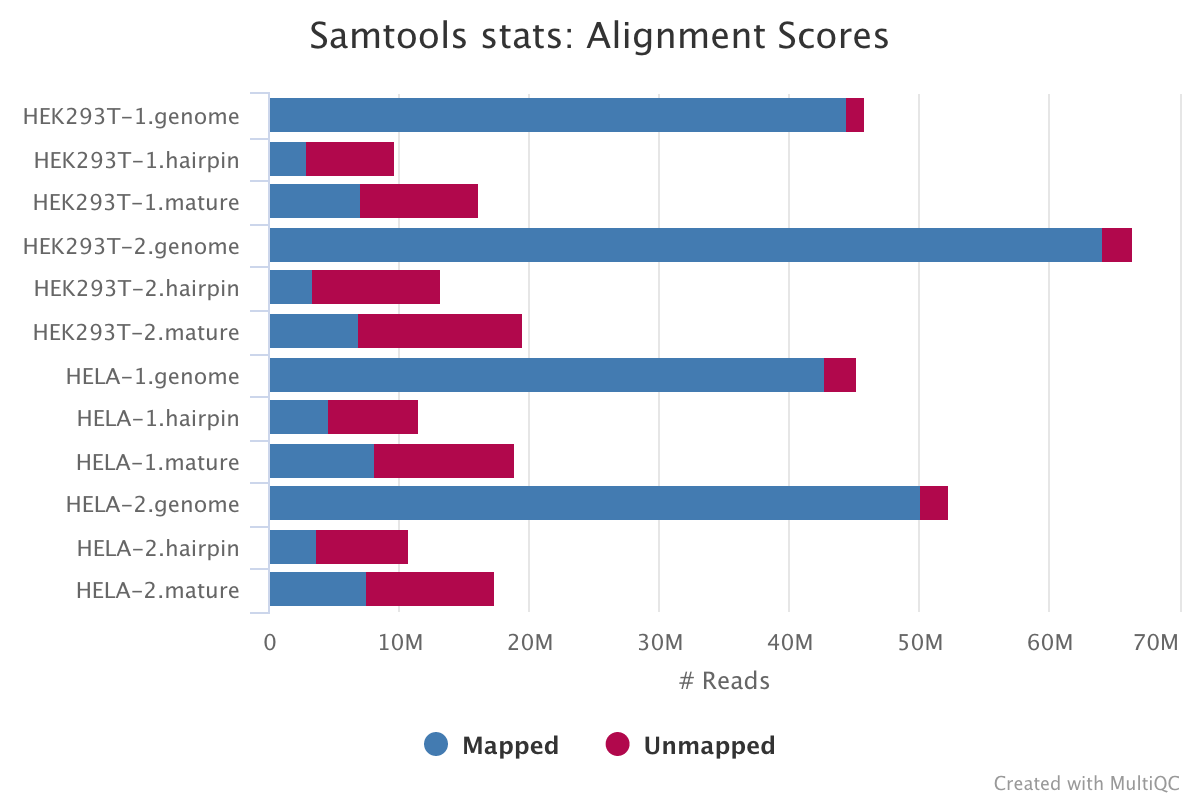
SAMtools
SAMtools is used for sorting and indexing the output BAM files from Bowtie. In addition, the numbers of features are counted with the idxstats option.
Output directory: results/{genome_quant,mirna_quant}/bam
These files will be saved in this directory if --save_intermediates is specified. In any case, these stats will always be available in the MultiQC report.
.*stats|.*idxstats|.*flagstat: BAM stats for each of the files listed above.
edgeR
edgeR is an R package used for differential expression analysis of RNA-seq expression profiles.
Output directory: results/mirna_quant/edger_qc
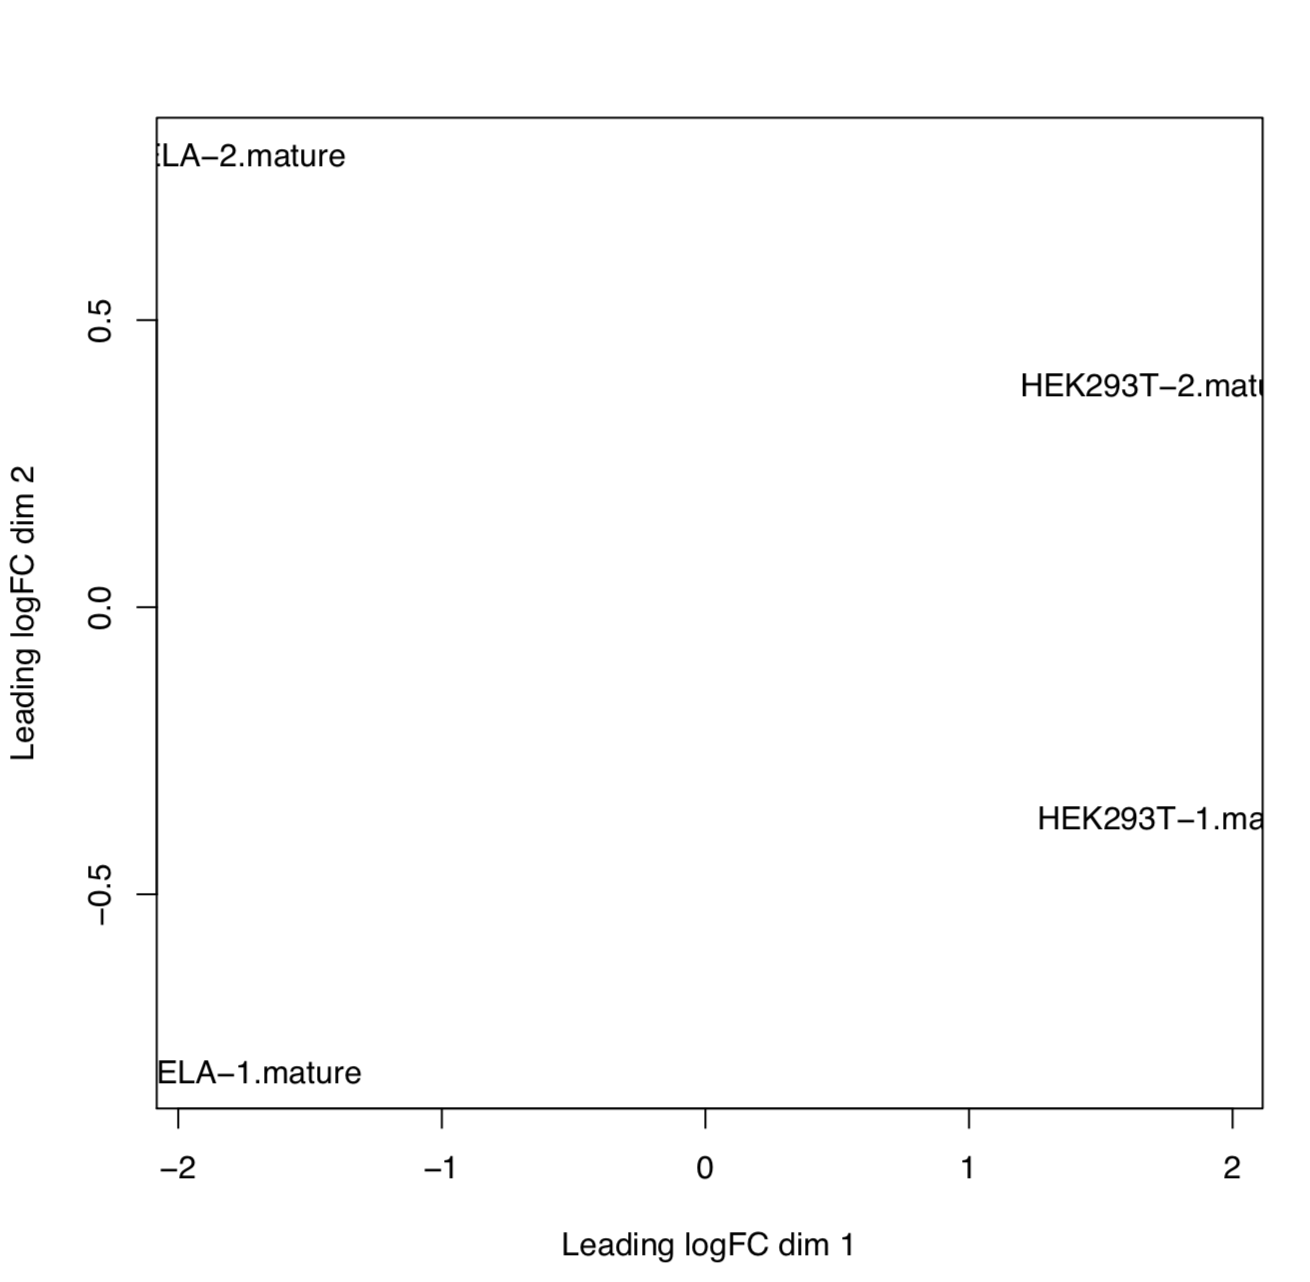
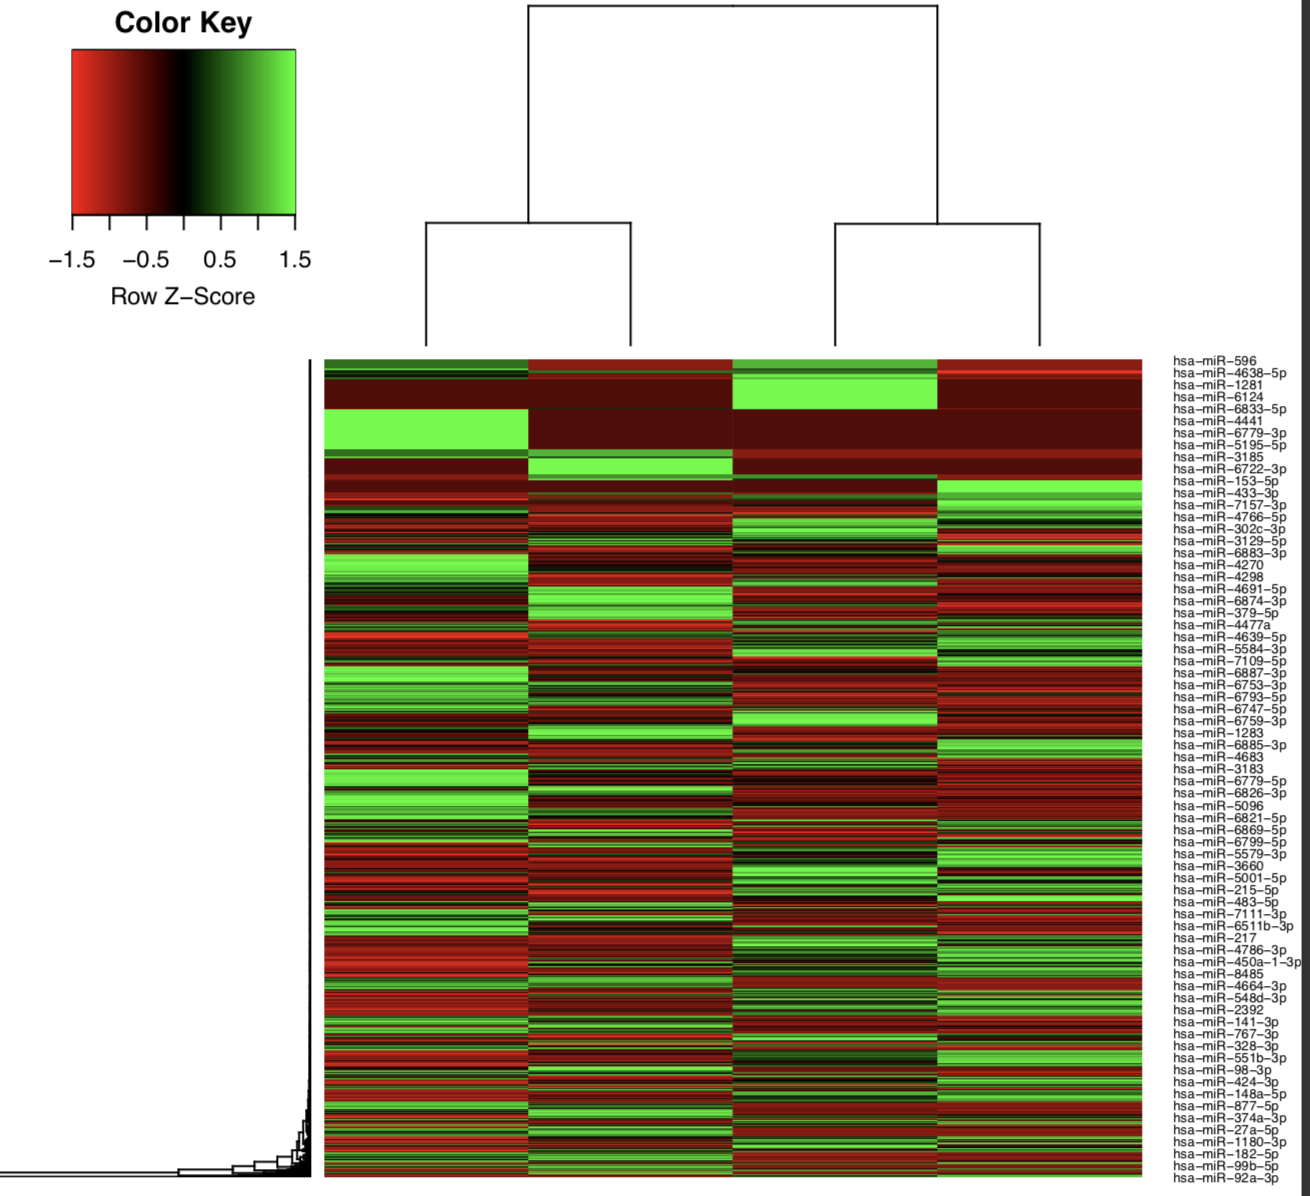
[mature/hairpin]_normalized_CPM.txtTMM normalized counts of reads aligned to mature miRNAs/miRNA precursors (hairpins)[mature/hairpin]_edgeR_MDS_plot.pdfMultidimensional scaling plot of all samples based on the expression profile of mature miRNAs/miRNA precursors (hairpins)[mature/hairpin]_CPM_heatmap.pdfHeatmap based on the expression profile of mature miRNAs/miRNA precursors (hairpins)[mature/hairpin]_log2CPM_sample_distances_dendrogram.pdfDendrograms of distance among samples based on the expression profile of mature miRNAs/miRNA precursors (hairpins)[mature/hairpin]_log2CPM_sample_distances_heatmap.pdfPairwise correlation of samples based on the expression profile of mature miRNAs/miRNA precursors (hairpins)
Example: MDS plot of 10 samples based on their expression profiles of mature miRNAs. Here we can see that samples cluster based on different sample types and library preparation kits.
Example: Heatmap of tumor and normal samples based on the top differentially expressed mature miRNAs.
mirtop
mirtop is used to parse the BAM files from bowtie alignment, and produce a mirgff3 file with information about miRNAs and isomirs.
Output directory: results/mirna_quant/mirtop
gff/{sample.id}.gff: mirgff3 filejoined_samples_mirtop.tsv: a tabular version of the previous file for easy integration with downstream analysis.export/{sample.id}_mirtop_rawData.tsv: File compatible with isomiRs Bioconductor package to perform isomiRs analysis.mirna.tsv: tabular file with miRNA counts after summarizing unique isomiRs for each miRNA
miRDeep2
miRDeep2 is used for the identification of novel and known miRNAs in deep sequencing data.
Output directory: results/mirdeep2
mirdeep2/result_{sample.id}.bedFile with the known and novel miRNAs in bed format.mirdeep2/result_{sample.id}.csvFile with an overview of all detected miRNAs (known and novel) in csv format.mirdeep2/result_{sample.id}.htmlA HTML report with an overview of all detected miRNAs (known and novel) in html format.
miRTrace
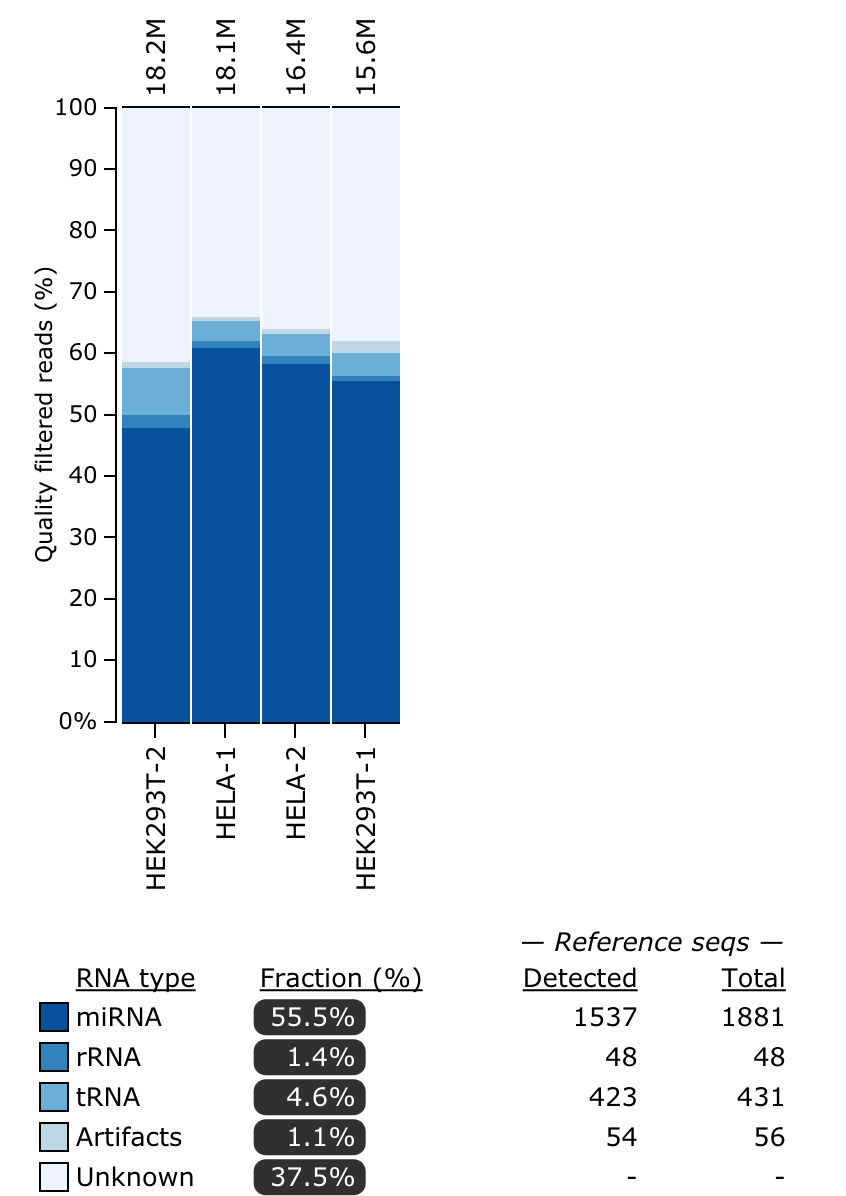
miRTrace is a quality control specifically for small RNA sequencing data (smRNA-Seq). Each sample is characterized by profiling sequencing quality, read length, sequencing depth and miRNA complexity and also the amounts of miRNAs versus undesirable sequences (derived from tRNAs, rRNAs and sequencing artifacts). By default, the pipeline sets the PHRED offset to the most common value of +33, so if you need to adjust this, use the params.phred_offset option to include this accordingly for your FASTQ files.
Output directory: results/mirtrace/${sample.id}
mirtrace-report.htmlAn interactive HTML report summarizing all output statistics from miRTracemirtrace-results.jsonA JSON file with all output statistics from miRTracemirtrace-stats-*.tsvTab-separated statistics filesqc_passed_reads.all.collapsedFASTA file per sample with sequence reads that passed QC in miRTraceqc_passed_reads.rnatype_unknown.collapsedFASTA file per sample with unknown reads in the RNA type analysis
The files for each sample can also be visualized into a single plot in the MultiQC report. Refer to the tool manual for detailed specifications about output files. Here is an example of the RNA types plot that you will see:
MultiQC

The FastQC plots displayed in the MultiQC report shows untrimmed reads. They may contain adapter sequence and potentially regions with low quality.
MultiQC
Output files
multiqc/multiqc_report.html: a standalone HTML file that can be viewed in your web browser.multiqc_data/: directory containing parsed statistics from the different tools used in the pipeline.multiqc_plots/: directory containing static images from the report in various formats.
MultiQC is a visualization tool that generates a single HTML report summarising all samples in your project. Most of the pipeline QC results are visualised in the report and further statistics are available in the report data directory.
Results generated by MultiQC collate pipeline QC from supported tools e.g. FastQC. The pipeline has special steps which also allow the software versions to be reported in the MultiQC output for future traceability. For more information about how to use MultiQC reports, see http://multiqc.info.
There may be a discrepancy in read counts number displayed in MultiQC between the original FASTQ and BAM files, this is due to secondary alignments being reported by the aligner, which can inflate the total read count number in the BAM files. More info about this behavior can be found here.
Pipeline information
Output files
pipeline_info/- Reports generated by Nextflow:
execution_report.html,execution_timeline.html,execution_trace.txtandpipeline_dag.dot/pipeline_dag.svg. - Reports generated by the pipeline:
pipeline_report.html,pipeline_report.txtandsoftware_versions.yml. Thepipeline_report*files will only be present if the--email/--email_on_failparameters are used when running the pipeline. - Reformatted samplesheet files used as input to the pipeline:
samplesheet.valid.csv. - Parameters used by the pipeline run:
params.json.
- Reports generated by Nextflow:
Nextflow provides excellent functionality for generating various reports relevant to the running and execution of the pipeline. This will allow you to troubleshoot errors with the running of the pipeline, and also provide you with other information such as launch commands, run times and resource usage.