nf-core/airrflow
B-cell and T-cell Adaptive Immune Receptor Repertoire (AIRR) sequencing analysis pipeline using the Immcantation framework
2.4.0). The latest stable release is5.1.0.Introduction
This document describes the output produced by the pipeline. Most of the plots are taken from the MultiQC report, which summarises results at the end of the pipeline.
The directories listed below will be created in the results directory after the pipeline has finished. All paths are relative to the top-level results directory.
Pipeline overview
The pipeline is built using Nextflow and processes data using the following steps:
- FastP - read quality control, adapter trimming and read clipping
- pRESTO - read pre-processing
- Filter by sequence quality - filter sequences by quality
- Mask primers - Masking primers
- Pair mates - Pairing sequence mates.
- Cluster sets - Cluster sequences according to similarity.
- Build consensus - Build consensus of sequences with the same UMI barcode.
- Re-pair mates - Re-pairing sequence mates.
- Assemble mates - Assemble sequence mates.
- Remove duplicates - Remove and annotate read duplicates.
- Filter sequences for at least 2 representative Filter sequences that do not have at least 2 duplicates.
- FastQC - read quality control post-assembly
- Change-O - Assign genes and clonotyping
- Shazam - Genotyping and Clonal threshold
- Change-O define clones
- Define clones - Defining clonal B-cell or T-cell groups
- Reconstruct germlines - Reconstruct gene calls of germline sequences
- Lineage reconstruction - Clonal lineage reconstruction.
- Repertoire analysis - Repertoire analysis and comparison.
- Log parsing - Log parsing.
- Databases
- MultiQC - MultiQC
- Pipeline information - Pipeline information
Fastp
Output files
fastp/<sample_id>/*.fastp.html: Fast report containing quality metrics for the mated and quality filtered reads.*.fastp.json: Zip archive containing the FastQC report, tab-delimited data file and plot images for the mated and quality filtered reads.*.fastp.log: Fastp
fastp gives general quality metrics about your sequenced reads, as well as allows filtering reads by quality, trimming adapters and clipping reads at 5’ or 3’ ends. It provides information about the quality score distribution across your reads, per base sequence content (%A/T/G/C), adapter contamination and overrepresented sequences. For further reading and documentation see the fastp documentation.
presto
NB: If using the sans-UMI subworkflow by specifying
umi_length=0, the presto directory ordering numbers will differ e.g., mate pair assembly results will be output topresto/01-assemblepairs/<sampleID>as this will be the first presto step.
Filter by sequence quality
Output files
presto/01-filterseq/<sampleID>logs: Raw command logs of the process that will be parsed to generate a report.tabs: Table containing read ID and quality for each of the read files.
Filters reads that are below a quality threshold by using the tool FilterSeq from the pRESTO Immcantation toolset. The default quality threshold is 20.
Mask primers
Output files
presto/02-maskprimers/<sampleID>logs: Raw command logs of the process that will be parsed to generate a report.tabs: Table containing a read ID, the identified matched primer and the error for primer alignment.
Masks primers that are provided in the C-primers and V-primers input files. It uses the tool MaskPrimers of the pRESTO Immcantation toolset.
Pair mates
Output files
presto/03-pairseq/<sampleID>logs: Raw command logs of the process that will be parsed to generate a report.
Pair read mates using PairSeq from the pRESTO Immcantation toolset.
Cluster sets
Output files
presto/04-cluster_sets/<sampleID>logs: Raw command logs of the process that will be parsed to generate a report.tabs: Table containing a read ID, the identified barcode, the cluster id and the number of sequences in the cluster.
Cluster sequences according to similarity, using ClusterSets set. This step is introduced to deal with too low UMI diversity.
Parse clusters
Output files
presto/05-parse_clusters/<sampleID>logs: Raw command logs of the process that will be parsed to generate a report.
Annotate cluster ID as part of the barcode, using Parseheaders copy. This step is introduced to deal with too low UMI diversity.
Build UMI consensus
Output files
presto/06-build_consensus/<sampleID>logs: Raw command logs of the process that will be parsed to generate a report.tabs: Table containing the sequence barcode, number of sequences used to build the consensus (SEQCOUNT), the identified primer (PRIMER), the number of sequences for each primer (PRCOUNT), the primer consensus (PRCONS), the primer frequency (PRFREQ) and the number of sequences used to build the consensus (CONSCOUNT).
Build sequence consensus from all sequences that were annotated to have the same UMI. Uses BuildConsensus from the pRESTO Immcantation toolset.
Re-pair mates
Output files
presto/07-pairseq_postconsensus/<sampleID>logs: Raw command logs of the process that will be parsed to generate a report.
Re-pair read mates using PairSeq from the pRESTO Immcantation toolset.
Assemble mates
Output files
presto/08-assemblepairs/<sampleID>logs: Raw command logs of the process that will be parsed to generate a report.tabs: Parsed log contaning the sequence barcodes and sequence length, bases of the overlap, error of the overlap and p-value.
Assemble read mates using AssemblePairs from the pRESTO Immcantation toolset.
Remove duplicates
Output files
presto/09-collapseseq/<sampleID>logs: Raw command logs of the process that will be parsed to generate a report.tabs: Parsed log containing the sequence barcodes, header information and deduplicate count.
Remove duplicates using CollapseSeq from the pRESTO Immcantation toolset.
Filter sequences for at least 2 representatives
Output files
presto/10-splitseq/<sampleID>logs: Raw command logs of the process that will be parsed to generate a report.
Remove sequences which do not have 2 representative using SplitSeq from the pRESTO Immcantation toolset.
FastQC
Output files
fastqc/postassembly/*_ASSEMBLED_fastqc.html: FastQC report containing quality metrics for the mated and quality filtered reads.*_ASSEMBLED_fastqc.zip: Zip archive containing the FastQC report, tab-delimited data file and plot images for the mated and quality filtered reads.
FastQC gives general quality metrics about your sequenced reads. It provides information about the quality score distribution across your reads, per base sequence content (%A/T/G/C), adapter contamination and overrepresented sequences. For further reading and documentation see the FastQC help pages.
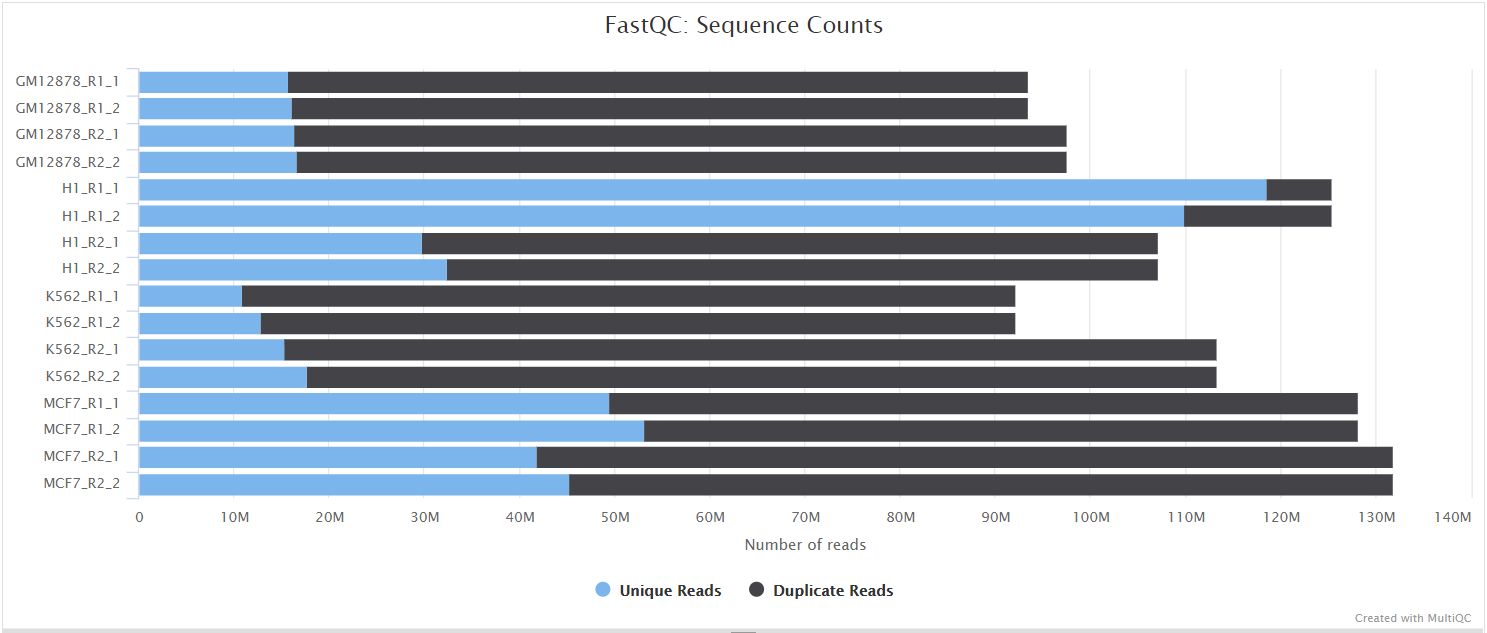
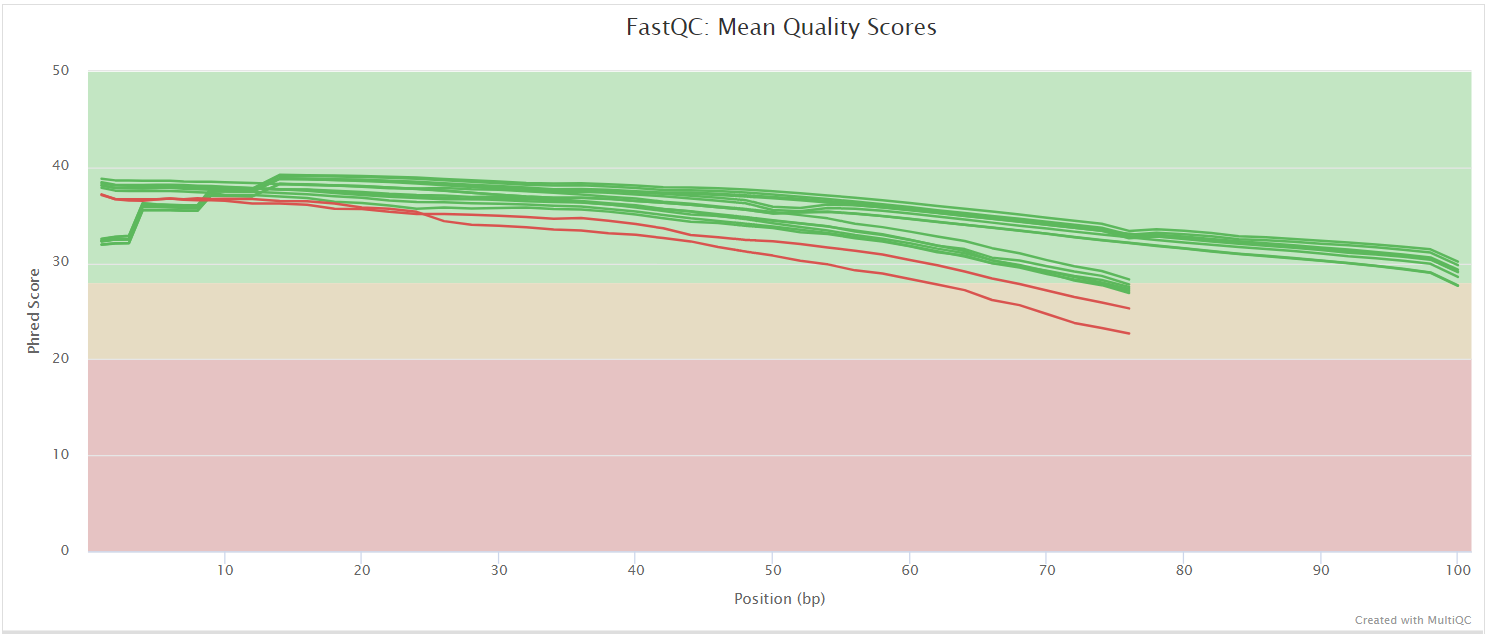
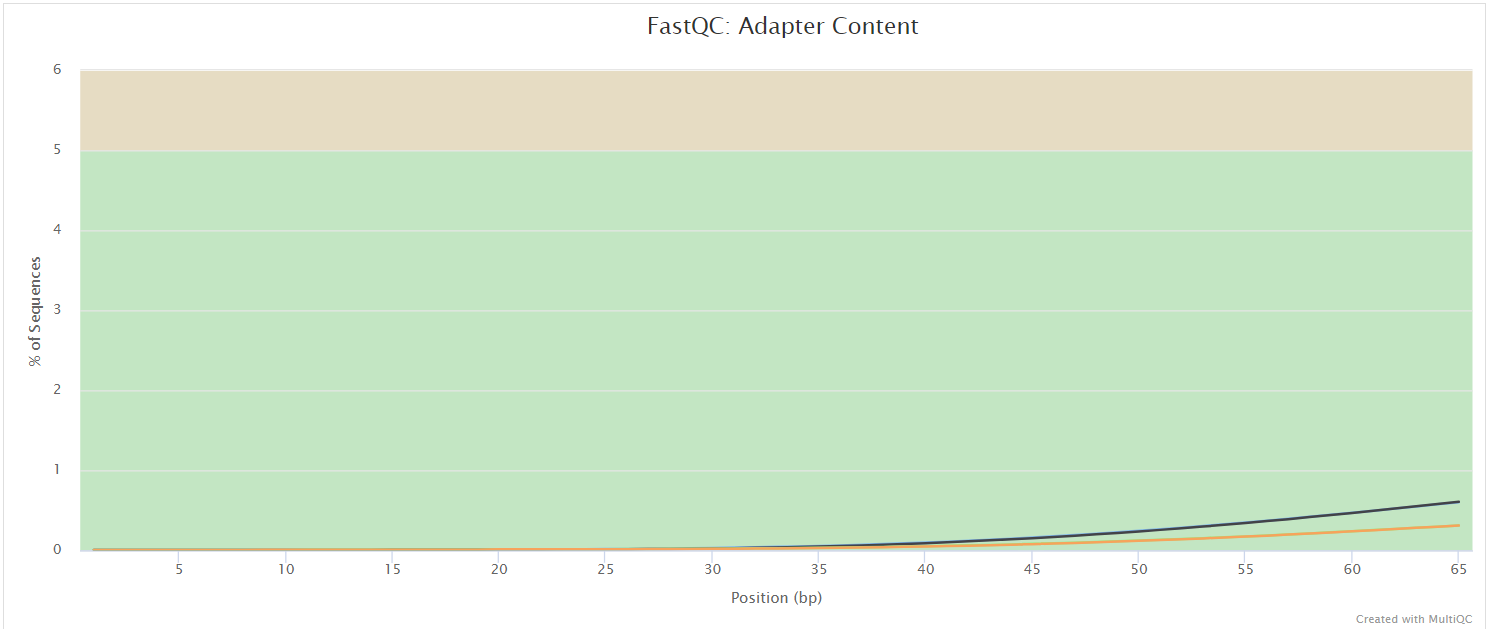
NB: Two sets of FastQC plots are displayed in the MultiQC report: first for the raw untrimmed and unmated reads and secondly for the assembled and QC filtered reads (but before collapsing duplicates). They may contain adapter sequence and potentially regions with low quality.
Change-O
Assign genes with Igblast
Output files
changeo/01-assigngenes/<sampleID>fasta/*.fasta: Igblast results converted to fasta format with genotype V-call annotated in the header.
Assign genes with Igblast, using the IMGT database is performed by the AssignGenes command of the Change-O tool from the Immcantation Framework.
Make database from assigned genes
Output files
changeo/02-makedb/<sampleID>logs: Log of the process that will be parsed to generate a report.tab: Table in AIRR format containing the assigned gene information and metadata provided in the starting metadata sheet.
A table is generated with MakeDB following the AIRR standards.
Removal of non-productive sequences
Output files
changeo/03-parsedb_split/<sampleID>logs: Log of the process that will be parsed to generate a report.tab: Table in AIRR format containing the assigned gene information, with only productive sequences and metadata provided in the starting metadata sheet.
Non-functional sequences are removed with ParseDb.
Selection of IGH / TR sequences
Output files
changeo/04-parsedb_select/<sampleID>logs: Log of the process that will be parsed to generate a report.tab: Table in AIRR format containing the assigned gene information, with only productive sequences and IGH/TR sequences, and metadata provided in the starting metadata sheet.
Heavy chain sequences (IGH) are selected if ‘ig’ locus is selected, TR sequences are selected if ‘tr’ locus is selected. The tool ParseDb is employed.
Convert database to fasta
Output files
changeo/05-convertdb-fasta/<sampleID>fasta: Fasta file containing the processed sequences with the barcode ID and allele annotation in the header.
Sequences in are additionally converted to a fasta file with the ConvertDb tool.
Shazam
Merging tables per subject
Output files
shazam/01-merged-tables/<subjectID>tab: Table in AIRR format containing the assigned gene information.
AIRR tables for each subject are merged to be able to determine the subject genotype and full clonal analysis.
Determining hamming distance threshold
Output files
shazam/02-clonal-threshold/<subjectID>threshold: Hamming distance threshold of the Junction regions as determined by Shazam.plots: Plot of the Hamming distance distribution between junction regions displaying the threshold for clonal assignment as determined by Shazam.
Determining the hamming distance threshold of the junction regions for clonal determination using Shazam.
Change-O define clones
Define clones
Output files
changeo/06-define_clones/<subjectID>tab: Table in AIRR format containing the assigned gene information and an additional field with the clone id.
Assigning clones to the sequences obtained from IgBlast with the DefineClones Immcantation tool.
Reconstruct germlines
Output files
changeo/07-create_germlines/<subjectID>tab: Table in AIRR format contaning the assigned gene information and an additional field with the germline reconstructed gene calls.
Reconstructing the germline sequences with the CreateGermlines Immcantation tool.
Lineage reconstruction
Output files
lineage_reconstruction/tabClones_table_patient.tsv: contains a summary of the clones found for the patient, and the number of unique and total sequences identified in each clone.Clones_table_patient_filtered_between_3_and_1000.tsv: contains a summary of the clones found for the patient, and the number of unique and total sequences identified in each clone, filtered by clones of size between 3 and 1000, for which the lineages were reconstructed and the trees plotted.xxx_germ-pass.tsv: AIRR format table with all the sequences from a patient after the germline annotation step.
Clone_tree_plots: Contains a rooted graphical representation of each of the clones, saved in pdf format.Graphml_trees: All lineage trees for the patient exported in a GraphML format:All_graphs_patient.graphml.
Reconstructing clonal linage with the Alakazam R package from the Immcantation toolset.
Repertoire comparison
Output files
repertoire_comparison/all_data.tsv: AIRR format table containing the processed sequence information for all subjects.Abundance: contains clonal abundance calculation plots and tables.Diversity: contains diversity calculation plots and tables.V_family: contains V gene and family distribution calculation plots and tables.
Bcellmagic_report.html: Contains the repertoire comparison results in an html report form: Abundance, Diversity, V gene usage tables and plots. Comparison between treatments and subjects.
Calculation of several repertoire characteristics (diversity, abundance, V gene usage) for comparison between subjects, time points and cell populations. An Rmarkdown report is generated with the Alakazam R package.
Log parsing
Output files
parsed_logs/sequences_table: table summarizing of the number of sequences after the most important pipeline steps.
Parsing the logs from the previous processes. Summary of the number of sequences left after each of the most important pipeline steps.
Databases
Copy of the downloaded IMGT database by the process fetch_databases, used for the gene assignment step.
MultiQC
Output files
multiqc/multiqc_report.html: a standalone HTML file that can be viewed in your web browser.multiqc_data/: directory containing parsed statistics from the different tools used in the pipeline.multiqc_plots/: directory containing static images from the report in various formats.
MultiQC is a visualization tool that generates a single HTML report summarising all samples in your project. Most of the pipeline QC results are visualised in the report and further statistics are available in the report data directory.
Results generated by MultiQC collate pipeline QC from supported tools e.g. FastQC. The pipeline has special steps which also allow the software versions to be reported in the MultiQC output for future traceability. For more information about how to use MultiQC reports, see http://multiqc.info.
Pipeline information
Output files
pipeline_info/- Reports generated by Nextflow:
execution_report.html,execution_timeline.html,execution_trace.txtandpipeline_dag.dot/pipeline_dag.svg. - Reports generated by the pipeline:
pipeline_report.html,pipeline_report.txtandsoftware_versions.yml. Thepipeline_report*files will only be present if the--email/--email_on_failparameter’s are used when running the pipeline. - Reformatted samplesheet files used as input to the pipeline:
samplesheet.valid.csv.
- Reports generated by Nextflow:
Nextflow provides excellent functionality for generating various reports relevant to the running and execution of the pipeline. This will allow you to troubleshoot errors with the running of the pipeline, and also provide you with other information such as launch commands, run times and resource usage.