nf-core/bacass
Simple bacterial assembly and annotation pipeline
Introduction
This document describes the output produced by the pipeline. Most of the plots are taken from the MultiQC report, which summarises results at the end of the pipeline.
The directories listed below will be created in the results directory after the pipeline has finished. All paths are relative to the top-level results directory.
Pipeline overview
The pipeline is built using Nextflow and processes data using the following steps:
- Quality trimming and QC
- Taxonomic classification
- Assembly Output
- Assembly QC with QUAST and BUSCO
- Annotation
- Report
- Pipeline information - Report metrics generated during the workflow execution
Quality trimming and QC
Short Read Trimming
This step quality trims the end of reads, removes degenerate or too short reads and if needed, combines reads coming from multiple sequencing runs.
Output files
trimming/shortreads/*.fastp.fastq.gz: The trimmed/modified/unmerged fastq reads
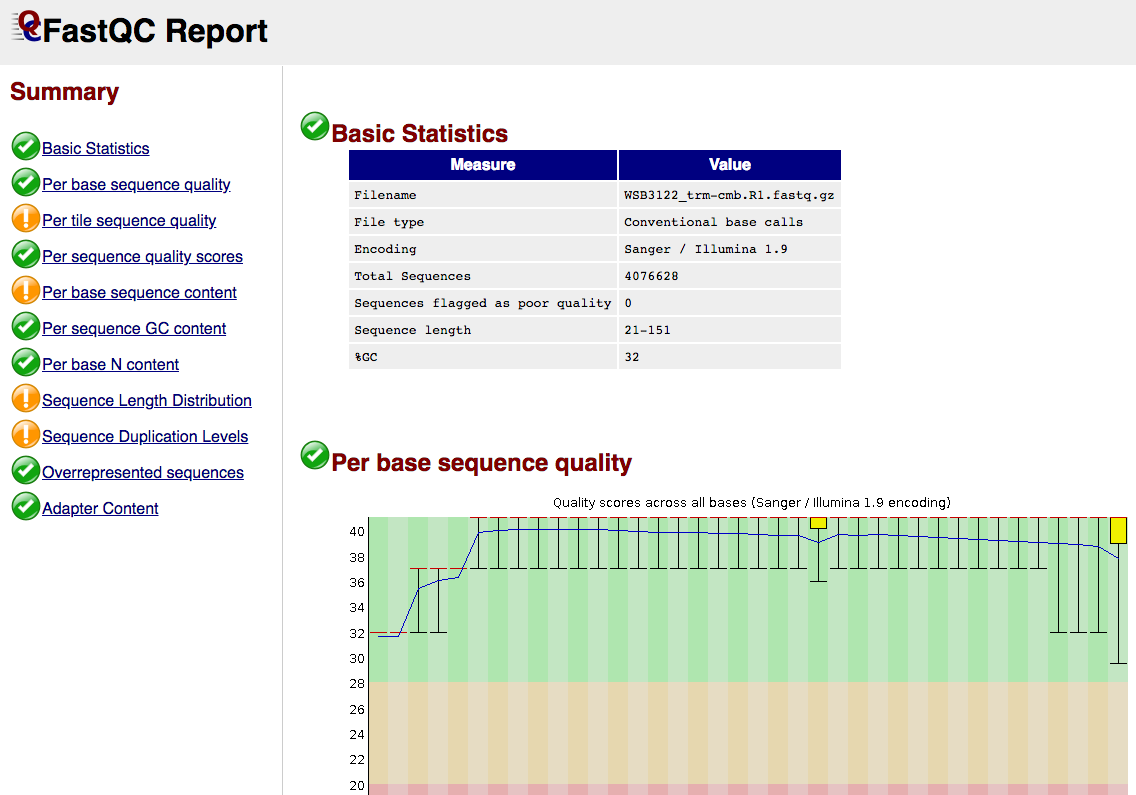
Short Read RAW QC
FastQC gives general quality metrics about your sequenced reads. It provides information about the quality score distribution across your reads, per base sequence content (%A/T/G/C), adapter contamination and overrepresented sequences. For further reading and documentation see the FastQC help pages.


The FastQC plots displayed in the MultiQC report shows untrimmed reads. They may contain adapter sequence and potentially regions with low quality.
Output files
FastQC/*.html: FastQC report containing quality metrics.*.zip: Zip archive containing the FastQC report, tab-delimited data file and plot images.
Long Read Trimming
This step performs long read trimming on Nanopore input (if provided) using PoreChop or filtering using Filtlong. Optionally, long reads can be downsampled to a target genome coverage using Rasusa prior to trimming.
Output files
-
trimming/longreads/porechop*.fastq.gz: The trimmed FASTQ file*.log*: Log file
-
trimming/longreads/filtlong*.fastq.gz: The trimmed FASTQ file*.log*: Log file
-
trimming/longreads/rasusa*.fastq.gz: The downsampled FASTQ file*.log*: Log file with downsampling statistics
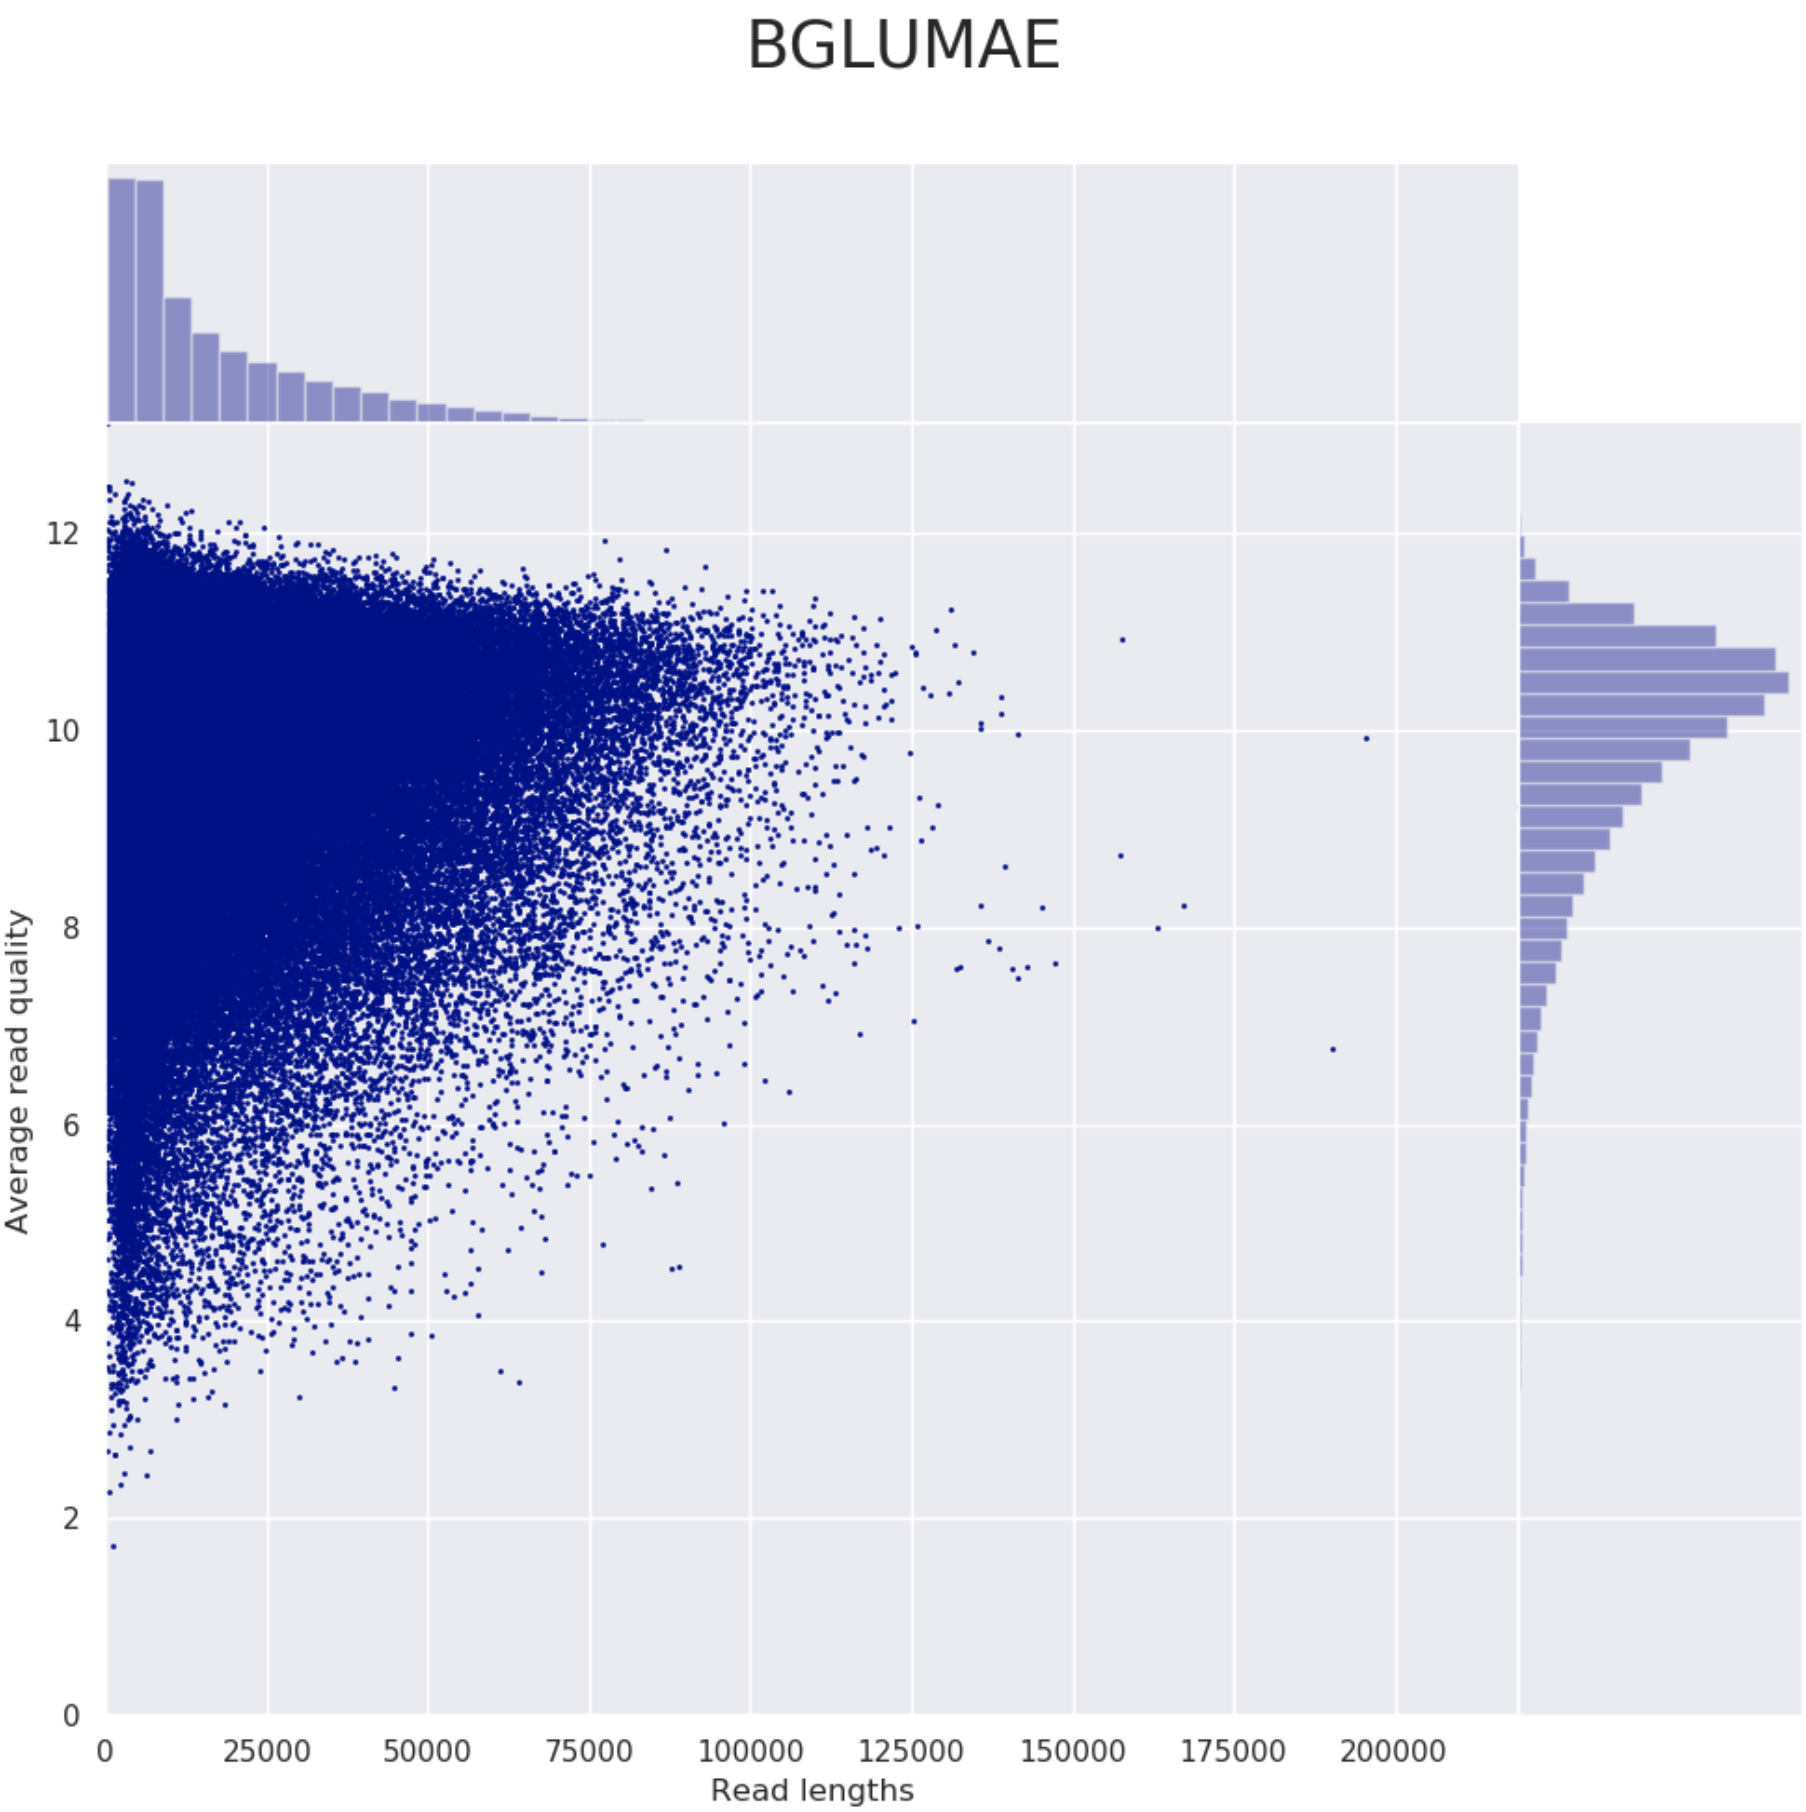
Long Read RAW QC
These steps perform long read QC for input data (if provided).
Please refer to the documentation of NanoPlot, PycoQC and ToulligQC if you want to know more about the plots created by these tools.
Output files
-
QC_Longreads/NanoPlot: Various plots in HTML and PNG format -
QC_Longreads/PycoQC*_pycoqc.html: QC report in HTML format*_pycoqc.json: QC report in JSON format
-
QC_Longreads/ToulligQC
*/report.html: QC report in HTML format
Example plot from Nanoplot:
Example plot from ToulligQC:
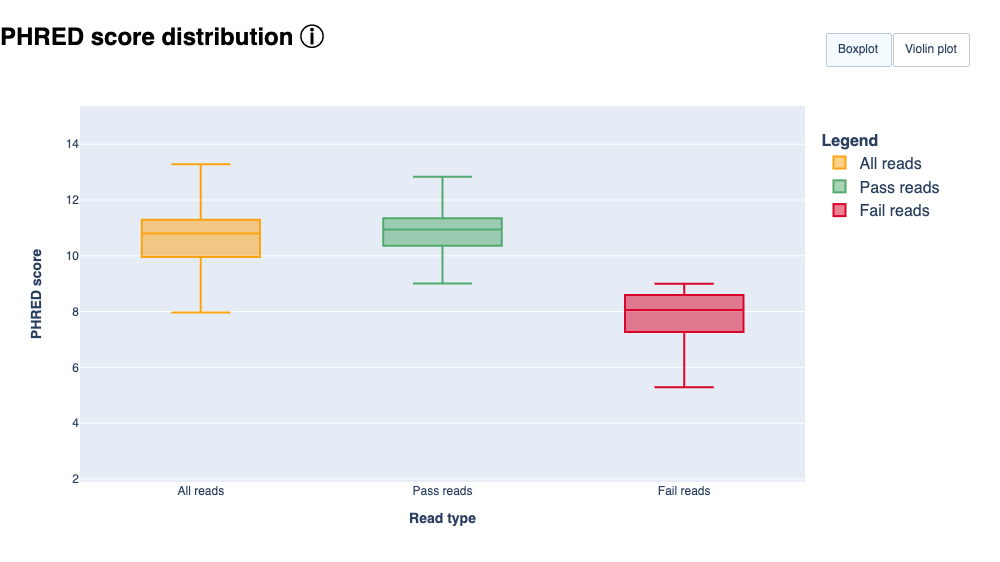
Example
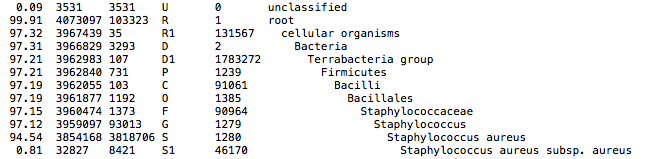
Taxonomic classification
This QC step classifies your reads using Kraken2 a k-mer based approach. This helps to identify samples that have purity issues. Ideally you will not want to assemble reads from samples that are contaminated or contain multiple species. If you like to visualize the report, try Pavian or Krakey.
Output files
Kraken2/*.kraken2.report.txt: Classification of short reads in the Kraken(1) report format.*_longreads.kraken2.report.txt: Classification of long reads in the Kraken(1) report format.
See webpage for more details.
Exemplary Kraken2 report screenshot:
Reads QC and Sample purity
The pipeline includes a dedicated step for short and long reads QC as well as contamination analysis using Kmerfinder. This process helps assess the quality and purity of the samples.
Output files
Kmerfinder/{ID}/*_results.txt: Kmerfinder report table containing reads QC results and taxonomic information.
Kmerfinder/kmerfinder_summary.csv: A CSV file containing the most relevant results of all samples analyzed with Kmerfinder.
Assembly Output
Trimmed reads are assembled with Unicycler or MEGAHIT in short assembly mode. In hybrid mode, Unicycler and Dragonflye are available. For long-read assembly, the pipeline supports Unicycler, Canu, Miniasm, Flye, Raven, Dragonflye, and Autocycler.
Unicycler is a pipeline on its own, which at least for Illumina reads mainly acts as a frontend to Spades with added polishing steps.
Output files
Unicycler/*-unicycler.scaffolds.fa: Final assembly in fasta format*-unicycler.assembly.gfa: Final assembly in Graphical Fragment Assembly (GFA) format*-unicycler.unicycler.log: Log file summarizing steps and intermediate results on the Unicycler execution
Check out the Unicycler documentation for more information on Unicycler output.
Megahit/*-megahit.contigs.fa.gz: Final assembly in FASTA format*-megahit.log: Log file summarizing MEGAHIT execution
Check out the MEGAHIT documentation for more information on MEGAHIT output.
Canu/*-canu.contigs.fasta.gz: Final assembly in fasta format*-canu.report: Log file summarizing steps and intermediate results
Check out the Canu documentation for more information on Canu output.
Miniasm/*-miniasm.fasta.gz: Assembly in Fasta format*-miniasm.consensus.fasta.gz: Consensus assembly in fasta format (polished by Racon)
Check out the Miniasm documentation for more information on Miniasm output.
Flye/*-flye.assembly.fasta.gz: Assembly in Fasta format
Check out the Flye documentation for more information on Flye output.
Raven/*-raven.fasta.gz: Assembly in Fasta format
Check out the Raven documentation for more information on Raven output.
Dragonflye/*-dragonflye.fa: Assembly in Fasta format*-dragonflye.dragonflye.log: Log file containing the report of the dragonflye process
Checkout the Dragonflye documentation for more information of the Dragonflye output.
Autocycler/<assembler>/<sample>-<subset>-<assembler>*.fasta.gz: Assembly ofassemblerandsampleofsubset. Also includes other assembler-specific files as detailed above.
Autocycler/combine/<sample>-autocycler/consensus_assembly.fasta: Assembly ofsamplein Fasta format<sample>-autocycler/consensus_assembly.gfa: Assembly ofsamplein Graphical Fragment Assembly (GFA) format<sample>-autocycler/consensus_assembly.yaml: Assembly statistics ofsamplein yaml format
Checkout the Autocycler documentation for more information of the Autocycler output.
Polished assemblies
Long reads assemblies can be polished using Medaka or NanoPolish with Fast5 files.
Output files
-
Medaka/*_polished_genome.fa*_polished_genome.fa: Polished consensus assembly in fasta formatcalls_to_draft.bam: Alignment in bam formatcalls_to_draft.bam.bai: Index of alignmentconsensus.fasta.gaps_in_draft_coords.bedconsensus_probs.hdf
-
Nanopolish/polished_genome.fa: Polished consensus assembly in fasta format
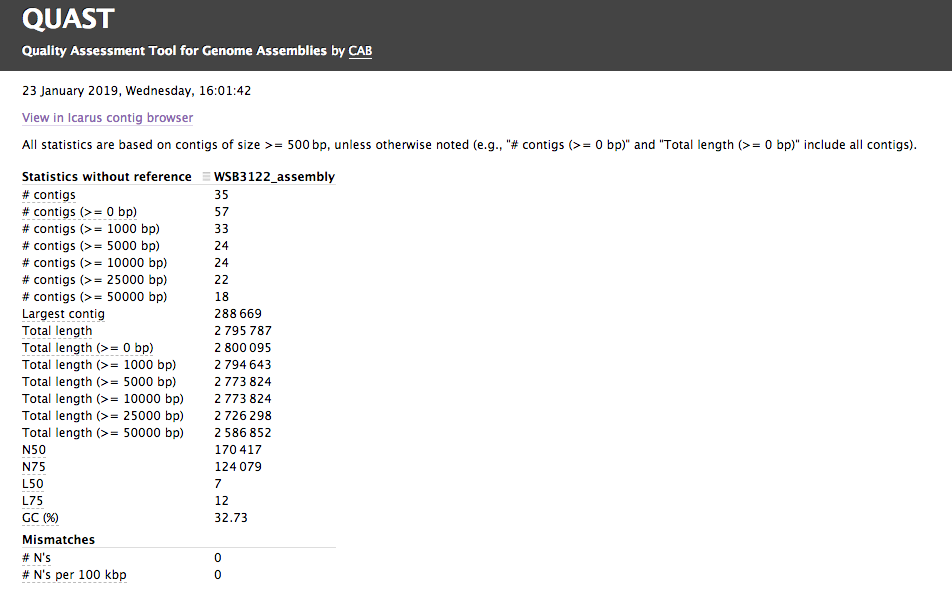
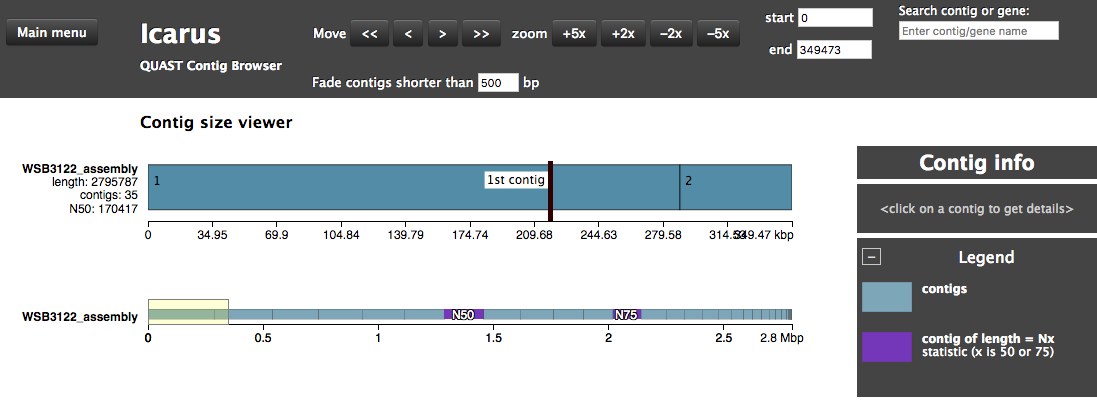
Assembly QC with QUAST and BUSCO
The assembly QC is performed with QUAST for all assemblies in one report. It reports multiple metrics including number of contigs, N50, lengths etc in form of an html report. It further creates an HTML file with integrated contig viewer (Icarus). It also runs BUSCO, a software which assess genome quality based on the presence of lineage-specific single-copy orthologs
Output files
QUAST/report/icarus.html: QUAST’s contig browser as HTMLreport.html: QUAST assembly QC as HTML reportreport.pdf: QUAST assembly QC as pdficarus.html: QUAST’s contig browser as HTMLreport.html: QUAST assembly QC as HTML reportreport.pdf: QUAST assembly QC as pdf
busco/: BUSCO reports<AssemblyName>_<stage>-<BuscoLineage>-busco/: BUSCO output folder, please refer to BUSCO documentation for details.<AssemblyName>_<stage>-<BuscoLineage>-busco.batch_summary.txt: BUSCO batch summary outputshort_summary.specific.<AssemblyName>_<stage>.{txt,json}: BUSCO short summaries in txt and json format
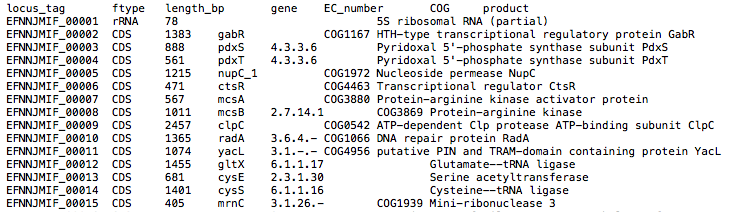
Annotation
By default, the assembly is annotated with Prokka which acts as frontend for several annotation tools and includes rRNA and ORF predictions. Alternatively, on request, the assembly is annotated with Bakta, DFAST or LIFTOFF.
Output files
Prokka/{ID}/*.gff: Annotation in gff format*.txt: Annotation in text format*.faa: Protein sequences in fasta format
See Prokka’s documentation for a full description of all output files.
Bakta/{ID}/*.gff3: Annotations in gff3 format*.txt: Summary in txt format*.faa: CDS/sORF amino acid sequences in fasta format
See Baktas’s documentation for a full description of all output files.
-
DFAST/{ID}_results/genome.gff: Annotation in gff formatstatistics.txt: Annotation statistics in text formatprotein.faa: Protein sequences in fasta format
-
LIFTOFF/{ID}.gff3: Annotation in gff format{ID}.polished.gff3: Polished lifted annotations in gff format{ID}.unmapped.txt: Unmapped reference annotations
See LIFTOFF’s documentation for a full description of all output files.
Report
Some pipeline results are visualised by MultiQC, which is a visualisation tool that generates a single HTML report summarising all samples in your project. Further statistics are available in within the report data directory.
MultiQC is a visualization tool that generates a single HTML report summarising all samples in your project. Most of the pipeline QC results are visualised in the report and further statistics are available in the report data directory.
The pipeline has special steps which also allow the software versions to be reported in the MultiQC output for future traceability.
Results generated by MultiQC collate pipeline QC from supported tools e.g. FastQC. The pipeline has special steps which also allow the software versions to be reported in the MultiQC output for future traceability. For more information about how to use MultiQC reports, see http://multiqc.info.
Output files
multiqc/multiqc_report.html: a standalone HTML file that can be viewed in your web browser.multiqc_data/: directory containing parsed statistics from the different tools used in the pipeline.multiqc_plots/: directory containing static images from the report in various formats.summary_assembly_metrics_mqc.csv: custom table containing most relevant assembly QC metrics.
Pipeline information
Nextflow provides excellent functionality for generating various reports relevant to the running and execution of the pipeline. This will allow you to troubleshoot errors with the running of the pipeline, and also provide you with other information such as launch commands, run times and resource usage.
Output files
pipeline_info/- Reports generated by Nextflow:
execution_report.html,execution_timeline.html,execution_trace.txtandpipeline_dag.dot/pipeline_dag.svg. - Reports generated by the pipeline:
pipeline_report.html,pipeline_report.txtandsoftware_versions.yml. Thepipeline_report*files will only be present if the--email/--email_on_failparameter’s are used when running the pipeline. - Reformatted samplesheet files used as input to the pipeline:
samplesheet.valid.csv. - Parameters used by the pipeline run:
params.json.
- Reports generated by Nextflow: