nf-core/rnafusion
RNA-seq analysis pipeline for detection of gene-fusions
2.2.0). The latest stable release is4.1.3.Introduction
This document describes the output produced by the pipeline. Most of the plots are taken from the MultiQC report, which summarises results at the end of the pipeline.
The directories listed below will be created in the results directory after the pipeline has finished. All paths are relative to the top-level results directory.
Pipeline overview
The pipeline is built using Nextflow and processes data using the following steps:
- Download and build references - Build references needed to run the rest of the pipeline
- STAR - Alignment for arriba, squid and STAR-fusion
- Cat - Concatenated fastq files per sample ID
- Arriba - Arriba fusion detection
- Pizzly - Pizzly fusion detection
- Squid - Squid fusion detection
- STAR-fusion - STAR-fusion fusion detection
- StringTie - StringTie assembly
- FusionCatcher - Fusion catcher fusion detection
- Samtools - SAM/BAM file manipulation
- Arriba visualisation - Arriba visualisation report
- Fusion-report - Summary of the findings of each tool and comparison to COSMIC, Mitelman and FusionGBD databases
- FusionInspector - IGV-based visualisation tool for fusions filtered by fusion-report
- Qualimap - Quality control of alignment
- Picard - Collect metrics
- FastQC - Raw read quality control
- MultiQC - Aggregate report describing results and QC from the whole pipeline
- Pipeline information - Report metrics generated during the workflow execution
Download and build references
Output files
genomes_base/arribablacklist_hg38_GRCh38_v2.1.0.tsv.gzprotein_domains_hg38_GRCh38_v2.1.0.gff3cytobands_hg38_GRCh38_v2.1.0.tsv
ensemblHomo_sapiens.GRCh38.{ensembl_version}.all.faHomo_sapiens.GRCh38.{ensembl_version}.cdna.all.fa.gzHomo_sapiens.GRCh38.{ensembl_version}.gtfHomo_sapiens.GRCh38.{ensembl_version}.chr.gtfHomo_sapiens.GRCh38.{ensembl_version}.chr.gtf.refflatHomo_sapiens.GRCh38.{ensembl_version}.interval_list
fusioncatcherhuman_v<version>- dir with all references for fusioncatcher
fusion_report_dbcosmic.dbfusiongdb.dbfusiongdb2.dbmitelman.db
pizzlykallisto- file containing the kallisto index
star- dir with STAR indexstarfusion- files and dirs used to build the index
ctat_genome_lib_build_dir- dir containing the index
(Only files or folders used by the pipeline are mentioned explicitly.)
STAR
STAR is used to align to genome reference
STAR is run 3 times:
For arriba with the parameters:
--readFilesCommand zcat \--outSAMtype BAM Unsorted \--outSAMunmapped Within \--outBAMcompression 0 \--outFilterMultimapNmax 50 \--peOverlapNbasesMin 10 \--alignSplicedMateMapLminOverLmate 0.5 \--alignSJstitchMismatchNmax 5 -1 5 5 \--chimSegmentMin 10 \--chimOutType WithinBAM HardClip \--chimJunctionOverhangMin 10 \--chimScoreDropMax 30 \--chimScoreJunctionNonGTAG 0 \--chimScoreSeparation 1 \--chimSegmentReadGapMax 3 \--chimMultimapNmax 50For squid with the parameters:
--twopassMode Basic \--chimOutType SeparateSAMold \--chimSegmentMin 20 \--chimJunctionOverhangMin 12 \--alignSJDBoverhangMin 10 \--outReadsUnmapped Fastx \--outSAMstrandField intronMotif \--outSAMtype BAM SortedByCoordinate \--readFilesCommand zcatFor STAR-fusion with the parameters:
--twopassMode Basic \--outReadsUnmapped None \--readFilesCommand zcat \--outSAMstrandField intronMotif \--outSAMunmapped Within \--chimSegmentMin 12 \--chimJunctionOverhangMin 8 \--chimOutJunctionFormat 1 \--alignSJDBoverhangMin 10 \--alignMatesGapMax 100000 \--alignIntronMax 100000 \--alignSJstitchMismatchNmax 5 -1 5 5 \--chimMultimapScoreRange 3 \--chimScoreJunctionNonGTAG -4 \--chimMultimapNmax 20 \--chimNonchimScoreDropMin 10 \--peOverlapNbasesMin 12 \--peOverlapMMp 0.1 \--alignInsertionFlush Right \--alignSplicedMateMapLminOverLmate 0 \--alignSplicedMateMapLmin 30 \--chimOutType JunctionsSTAR_FOR_STARFUSION uses
${params.ensembl_ref}/Homo_sapiens.GRCh38.${params.ensembl_version}.chr.gtfwhereas STAR_FOR_ARRIBA and STAR_FOR_SQUID use${params.ensembl_ref}/Homo_sapiens.GRCh38.${params.ensembl_version}.gtf
Output files
star_for_<tool>_ Common _<sample_id>.Log.final.out_<sample_id>.Log.progress.out_<sample_id>.SJ.out.tab_ For arriba: _<sample_id>.Aligned.out.bam_ For squid: _<sample_id>.Aligned.sortedByCoord.out.bam_<sample_id>.Chimeric.out.sam_<sample_id>.unmapped_1.fastq.gz_<sample_id>.unmapped_2.fastq.gz_ For starfusion: _<sample_id>.Aligned.sortedByCoord.out.bam_<sample_id>.Chimeric.out.junction
Cat
Cat is used to concatenate fastq files belonging to the same sample.
Output files
cat<sample_id>_1.merged.fastq.gz<sample_id>_2.merged.fastq.gz
Arriba
Arriba is used for i) detect fusion and ii) output a PDF report for the fusions found (visualisation):
Detection
Output files
arriba<sample_id>.arriba.fusions.tsv- contains the identified fusions<sample_id>.arriba.fusions.discarded.tsv
Visualisation
Output files
arriba_visualisation<sample_id>.pdf
Pizzly
The first step of the pizzly workflow is to run kallisto quant:
Kallisto
Output files
kallisto<sample_id>.kallisto_quant.fusions.txt
Pizzly refines kallisto output.
Pizzly
Pizzly uses the following arguments:
-k 31 \--align-score 2 \--insert-size 400 \--cache index.cache.txtOutput files
pizzly<sample_id>.pizzly.txt- contains the identified fusions<sample_id>.pizzly.unfiltered.json
Squid
Squid is run in two steps: i) fusion detection and ii) fusion annotation but the output is in a common squid directory.
Output files
squid<sample_id>.squid.fusions_sv.txt- contains the identified fusions<sample_id>.squid.fusions.annotated.txt- contains the identified fusions annotatedvi
STAR-fusion
Output files
starfusion<sample_id>.starfusion.fusion_predictions.tsv- contains the identified fusions<sample_id>.starfusion.abridged.tsv- contains the identified fusions.starfusion.abridged.coding_effect.tsv
StringTie
Output files
stringtie/<sample_id>/stringtie.merged.gtf- merged gtf from annotation and stringtie output gtfs
FusionCatcher
Output files
fusioncatcher_<sample_id>.fusioncatcher.fusion-genes.txt_<sample_id>.fusioncatcher.summary.txt*<sample_id>.fusioncatcher.log
Samtools
Samtools view
Samtools view is used to convert the chimeric SAM output from STAR_FOR_SQUID to BAM
Output files
samtools_view_for_squid<sample_id>_chimeric.bam- sorted BAM file
Samtools sort
Samtools sort is used to sort BAM files from STAR_FOR_ARRIBA (for arriba visualisation) and the chimeric BAM from STAR_FOR_SQUID
Output files
samtools_sort_for_<arriba/squid><sample_id>(_chimeric)_sorted.bam- sorted BAM file
Samtools index
Samtools index is used to index BAM files from STAR_FOR_ARRIBA (for arriba visualisation) and STAR_FOR_STARFUSION (for QC)
Output files
samtools_for_<arriba/qc><sample_id>.(Aligned.sortedByCoord).out.bam.bai-
Fusion-report
Output files
fusionreport- <sample_id>
<sample_id>.fusionreport.tsv<sample_id>.fusionreport_filtered.tsvindex.html- general report for all filtered fusions<fusion>.html- specific report for each filtered fusion
- <sample_id>
FusionInspector
Output files
fusioninspector<sample_id>.fusion_inspector_web.html- visualisation report described in details hereFusionInspector.log<sample_id>.FusionInspector.fusions.abridged.tsv
Qualimap
Output files
qualimapqualimapReport.html- HTML reportrnaseq_qc_results.txt- TXT resultscss- dir for html styleimages_qualimapReport- dir for html imagesraw_data_qualimapReport- dir for html raw data
Picard
Picard CollectRnaMetrics and picard MarkDuplicates share the same outpur directory.
Output files
picard<sample_id>.MarkDuplicates.metrics.txt- metrics from CollectRnaMetrics<sample_id>_rna_metrics.txt- metrics from MarkDuplicates<sample_id>.bam- BAM file with marked duplicates
FastQC
Output files
fastqc/*_fastqc.html: FastQC report containing quality metrics.*_fastqc.zip: Zip archive containing the FastQC report, tab-delimited data file and plot images.
FastQC gives general quality metrics about your sequenced reads. It provides information about the quality score distribution across your reads, per base sequence content (%A/T/G/C), adapter contamination and overrepresented sequences. For further reading and documentation see the FastQC help pages.
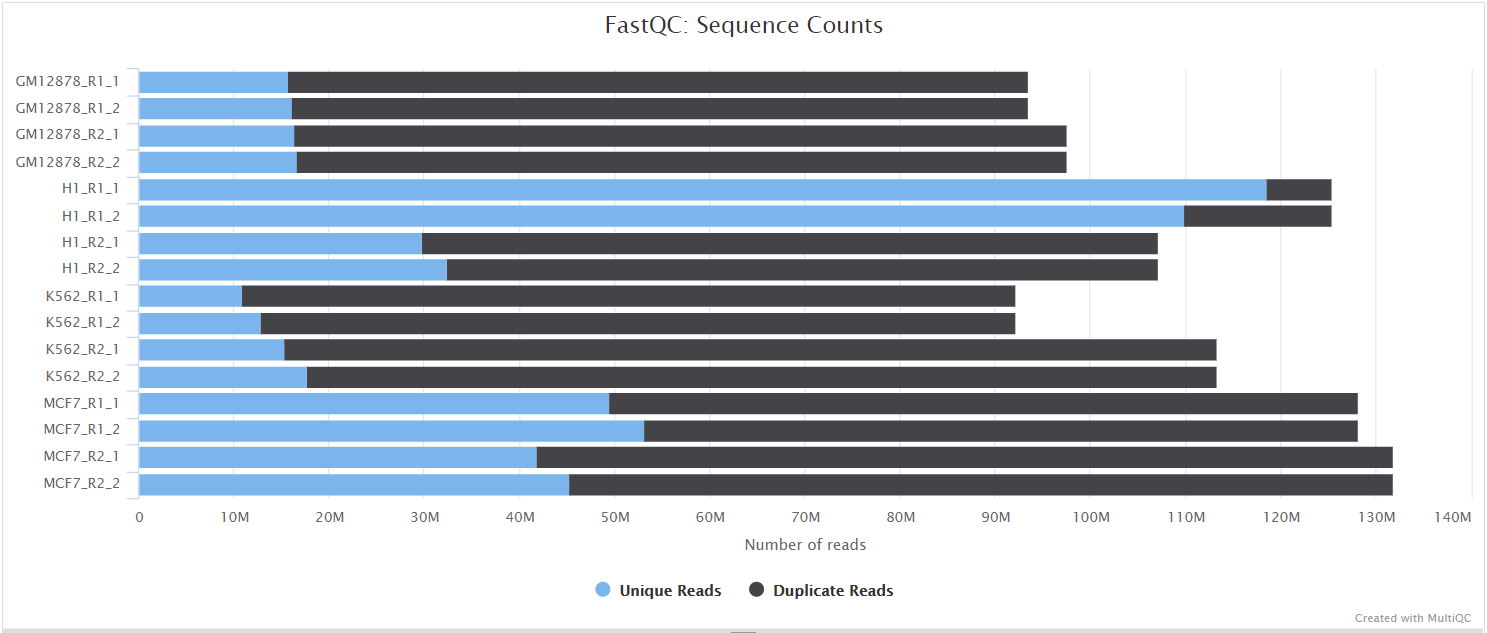
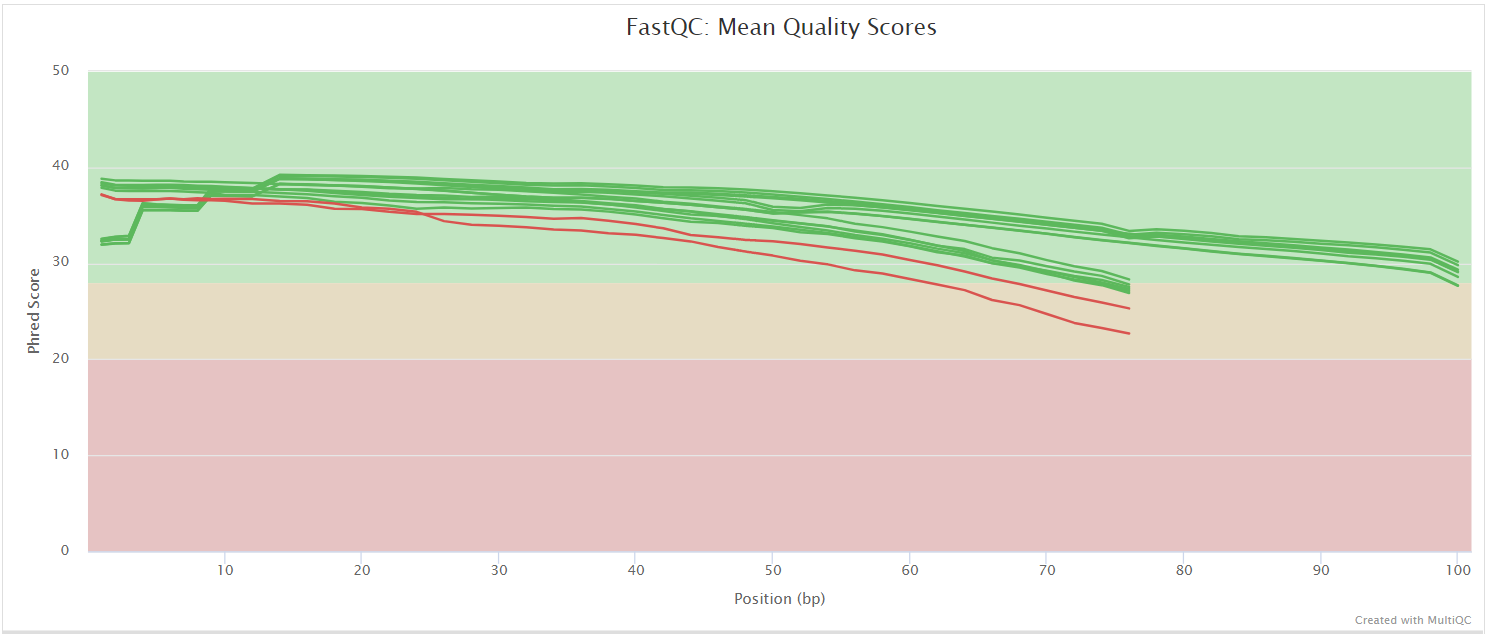
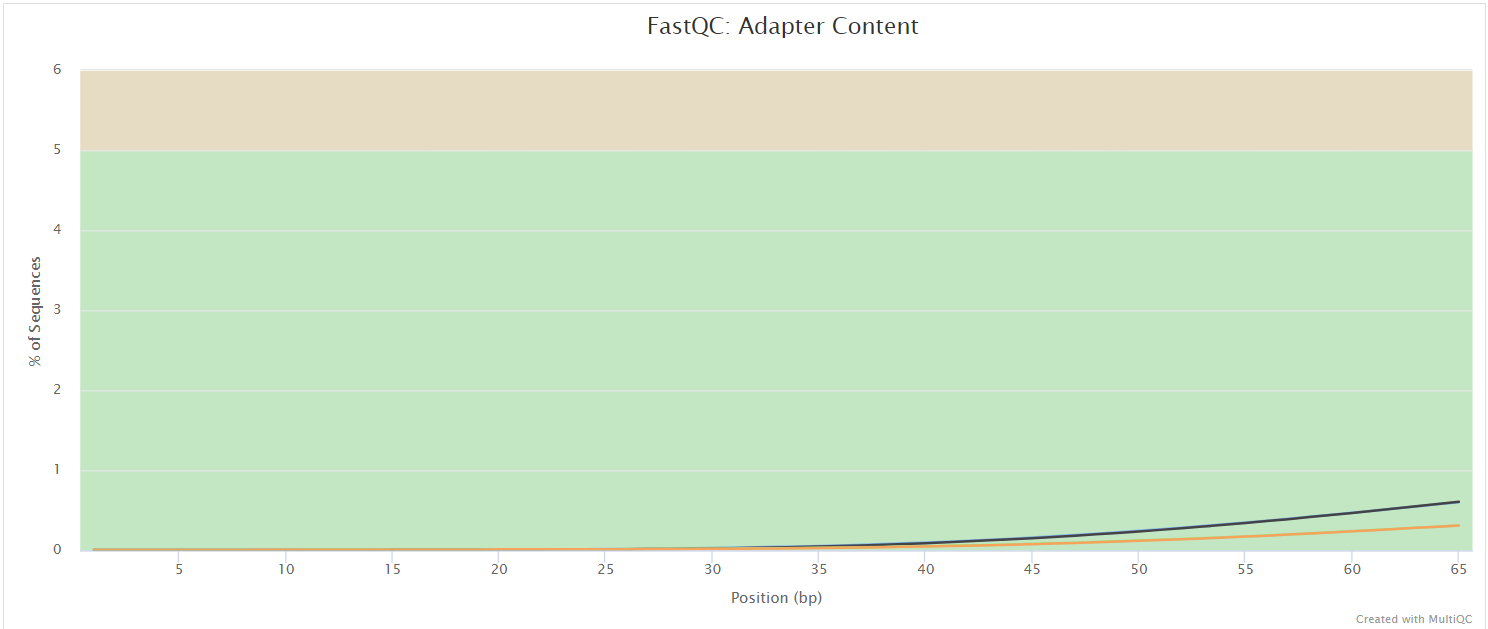
NB: The FastQC plots displayed in the MultiQC report shows untrimmed reads. They may contain adapter sequence and potentially regions with low quality.
MultiQC
Output files
multiqc/multiqc_report.html: a standalone HTML file that can be viewed in your web browser.multiqc_data/: directory containing parsed statistics from the different tools used in the pipeline.multiqc_plots/: directory containing static images from the report in various formats.
MultiQC is a visualization tool that generates a single HTML report summarising all samples in your project. Most of the pipeline QC results are visualised in the report and further statistics are available in the report data directory.
Results generated by MultiQC collate pipeline QC from supported tools e.g. FastQC. The pipeline has special steps which also allow the software versions to be reported in the MultiQC output for future traceability. For more information about how to use MultiQC reports, see http://multiqc.info.
Pipeline information
Output files
pipeline_info/- Reports generated by Nextflow:
execution_report.html,execution_timeline.html,execution_trace.txtandpipeline_dag.dot/pipeline_dag.svg. - Reports generated by the pipeline:
pipeline_report.html,pipeline_report.txtandsoftware_versions.yml. Thepipeline_report*files will only be present if the--email/--email_on_failparameter’s are used when running the pipeline. - Reformatted samplesheet files used as input to the pipeline:
samplesheet.valid.csv.
- Reports generated by Nextflow:
Nextflow provides excellent functionality for generating various reports relevant to the running and execution of the pipeline. This will allow you to troubleshoot errors with the running of the pipeline, and also provide you with other information such as launch commands, run times and resource usage.