nf-core/differentialabundance
Differential abundance analysis for feature/ observation matrices from platforms such as RNA-seq
Introduction
nf-core/differentialabundance is a bioinformatics pipeline that can be used to analyse data represented as matrices, comparing groups of observations to generate differential statistics and downstream analyses. The pipeline supports RNA-seq data such as that generated by the nf-core rnaseq workflow, and Affymetrix arrays via .CEL files. Other types of matrix may also work with appropriate changes to parameters, and PRs to support additional specific modalities are welcomed.
The pipeline is built using Nextflow, a workflow tool to run tasks across multiple compute infrastructures in a very portable manner. It uses Docker/Singularity containers making installation trivial and results highly reproducible. The Nextflow DSL2 implementation of this pipeline uses one container per process which makes it much easier to maintain and update software dependencies. Where possible, these processes have been submitted to and installed from nf-core/modules in order to make them available to all nf-core pipelines, and to everyone within the Nextflow community!
On release, automated continuous integration tests run the pipeline on a full-sized dataset on the AWS cloud infrastructure. This ensures that the pipeline runs on AWS, has sensible resource allocation defaults set to run on real-world datasets, and permits the persistent storage of results to benchmark between pipeline releases and other analysis sources. The results obtained from the full-sized test can be viewed on the nf-core website.
Pipeline summary

- Optionally generate a list of genomic feature annotations using the input GTF file (if a table is not explicitly supplied).
- Cross-check matrices, sample annotations, feature set and contrasts to ensure consistency.
- Run differential analysis over all contrasts specified.
- Optionally run a differential gene set analysis.
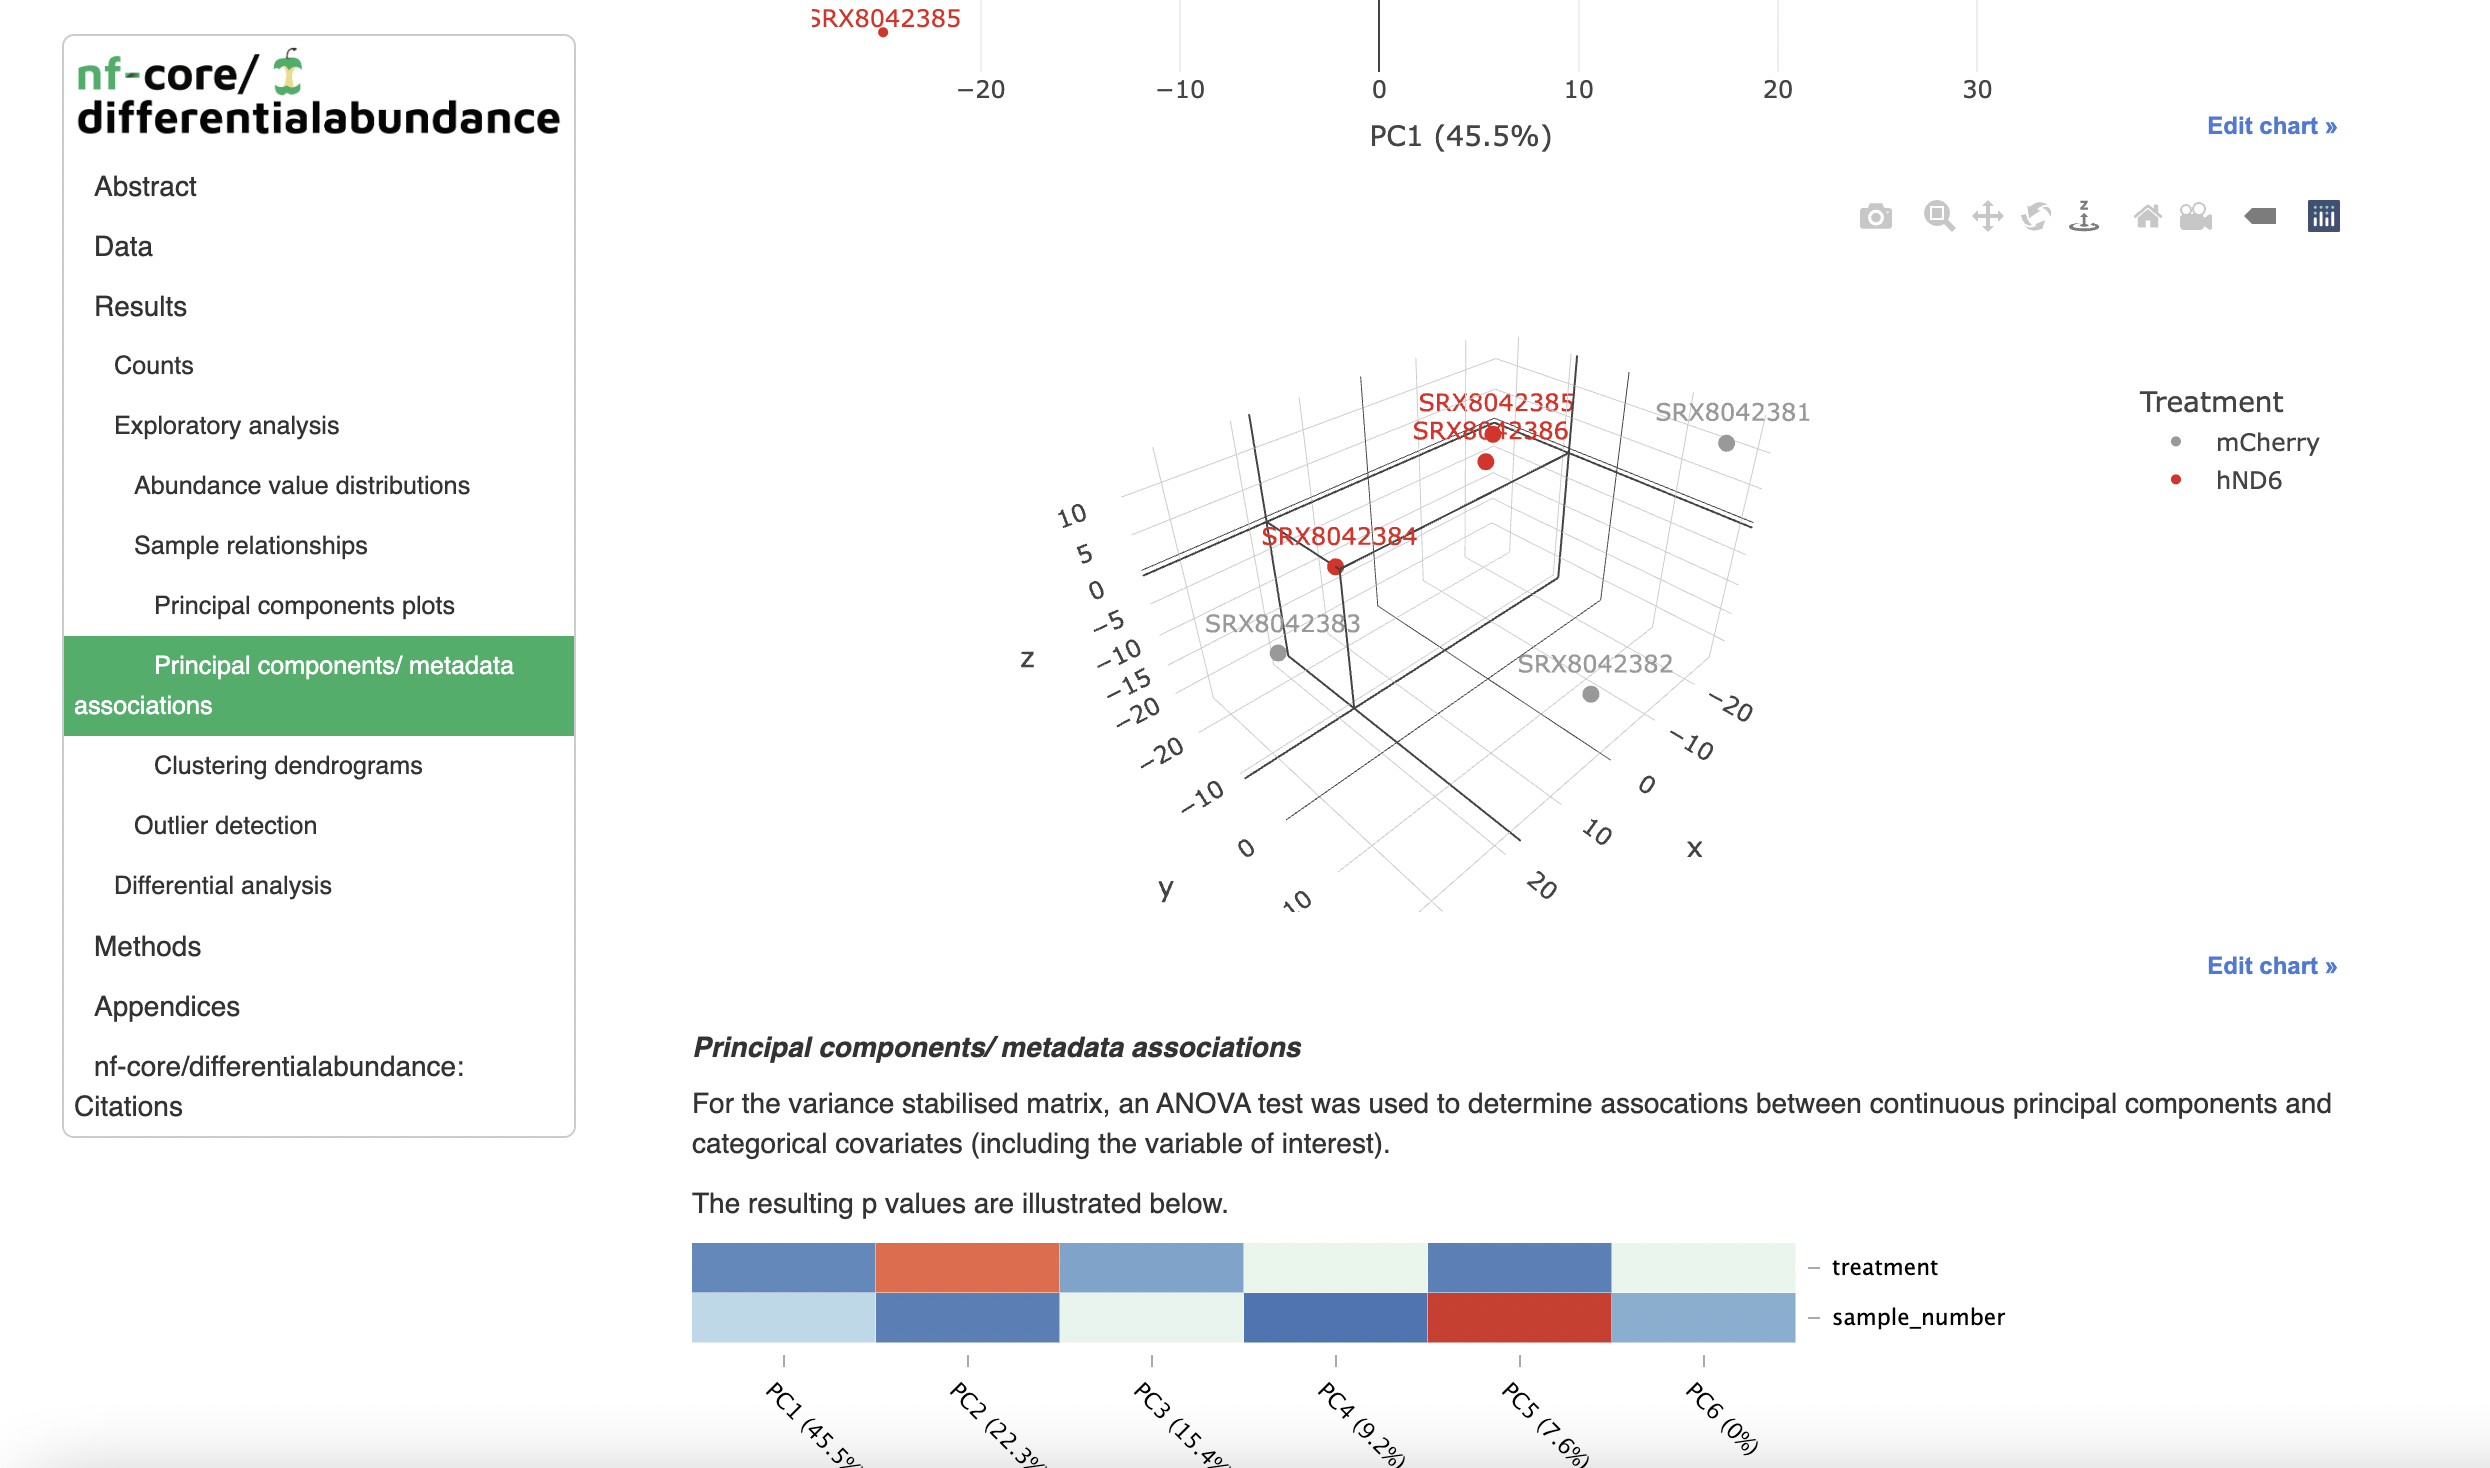
- Generate exploratory and differential analysis plots for interpretation.
- Run immunedeconv to estimate immune cell fractions using established deconvolution methods.
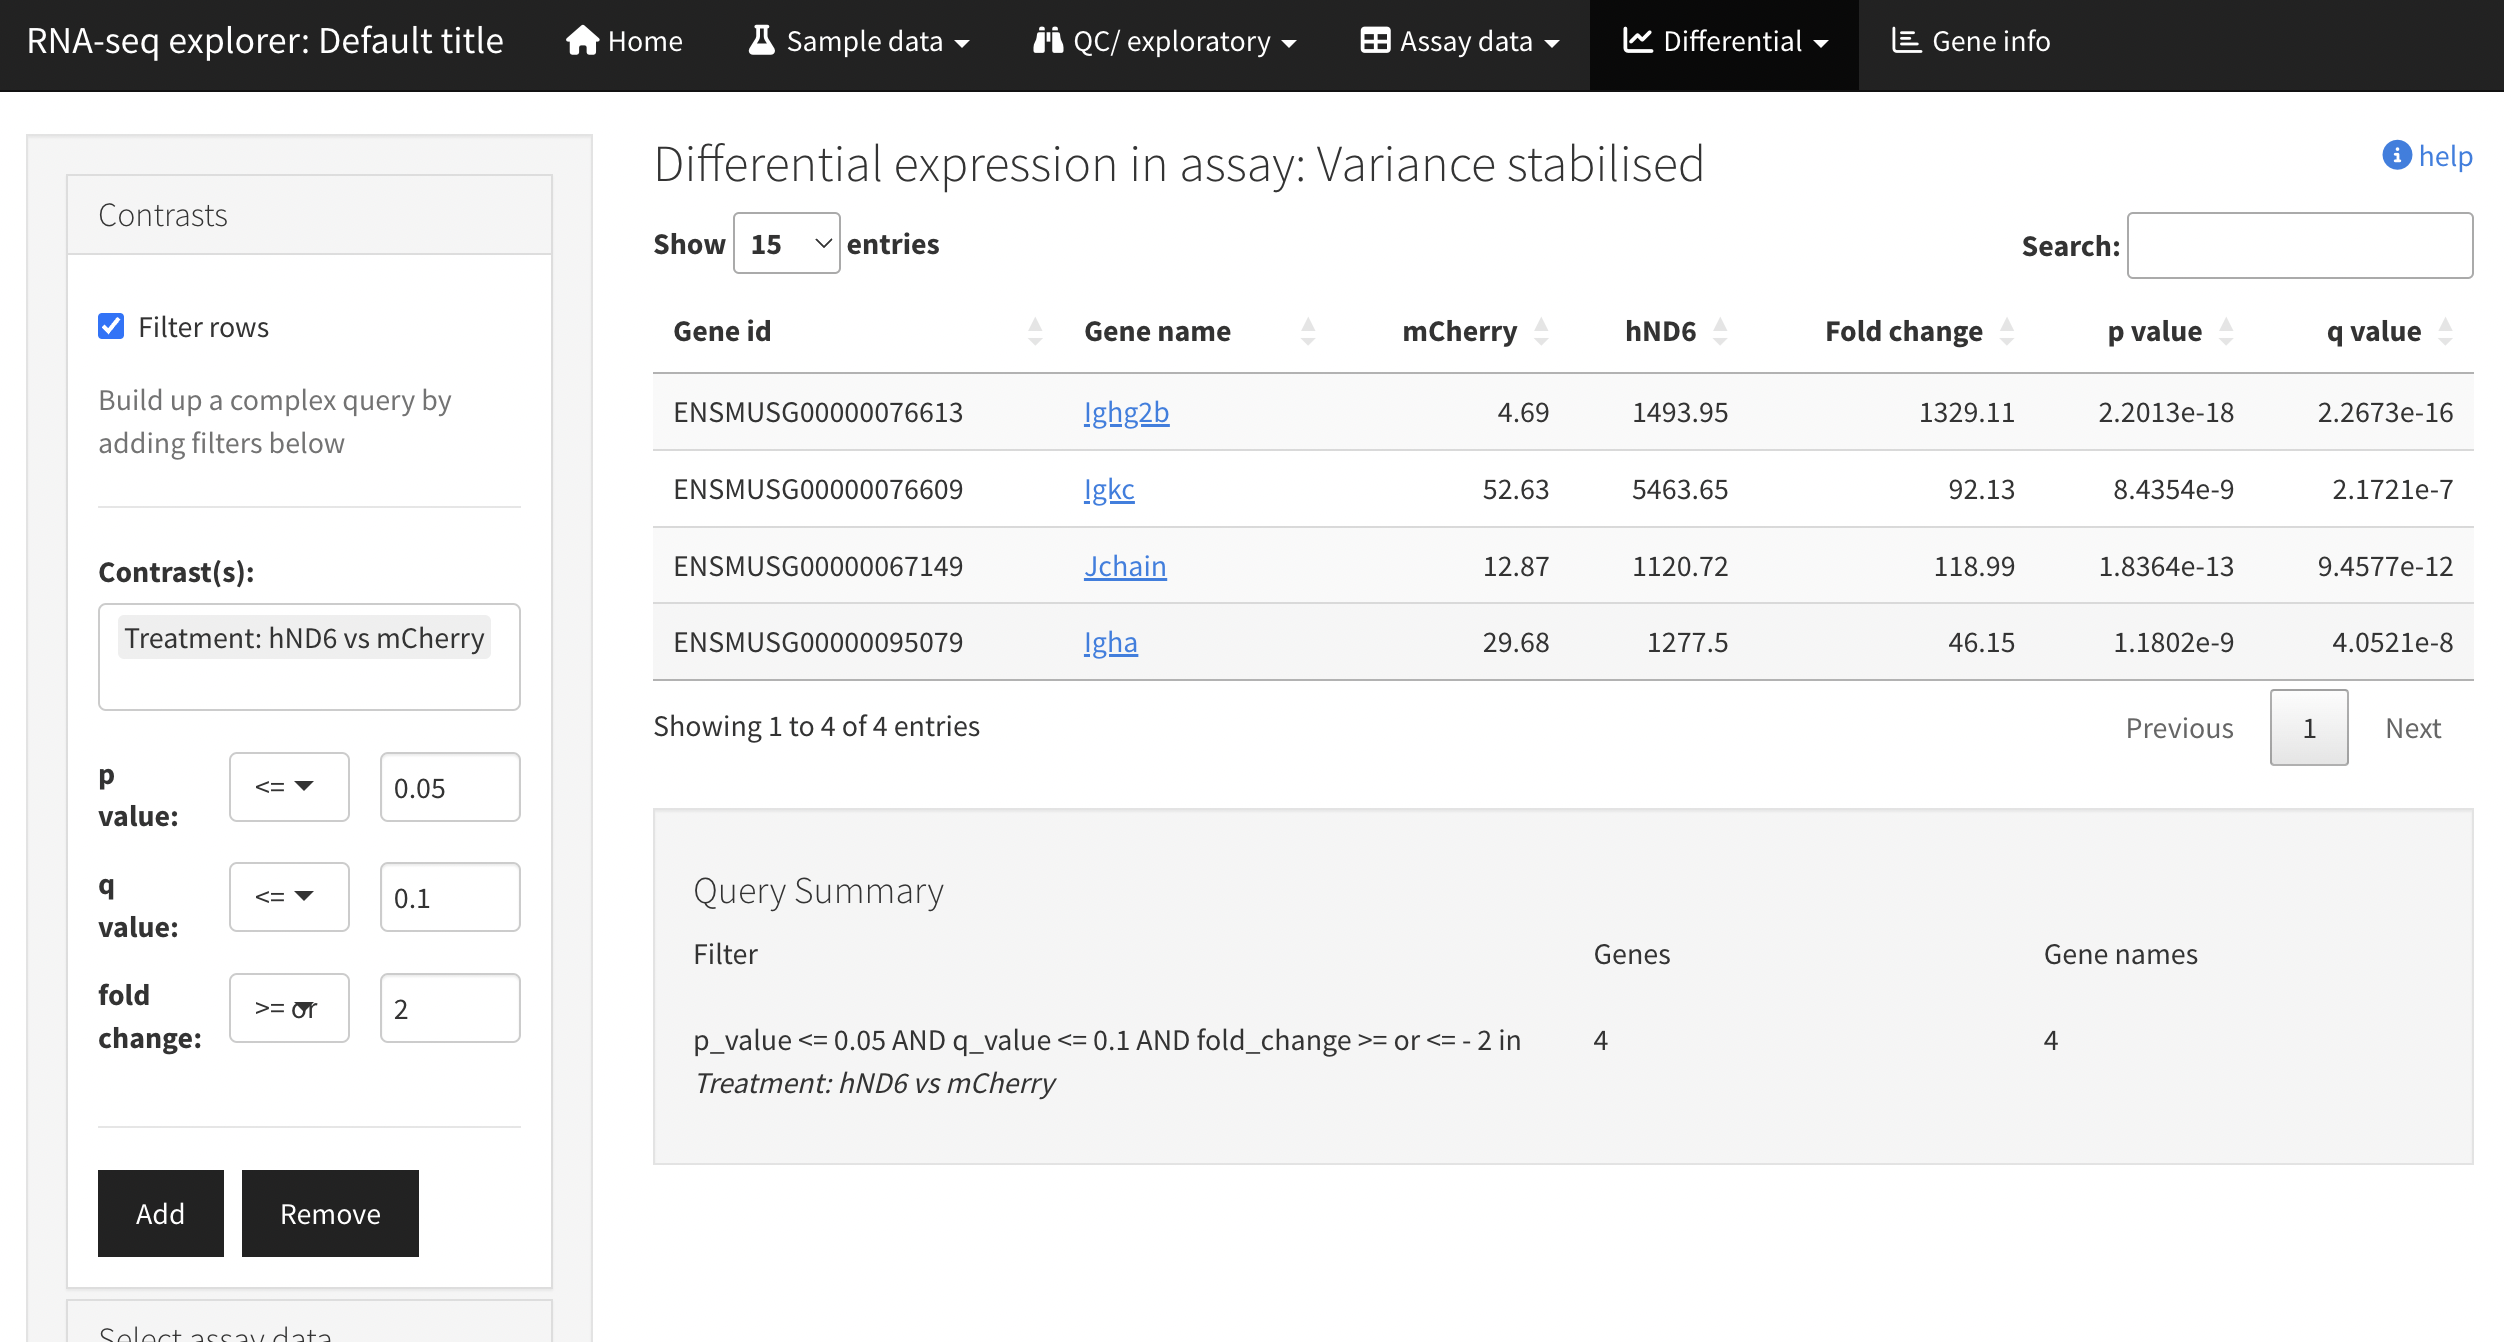
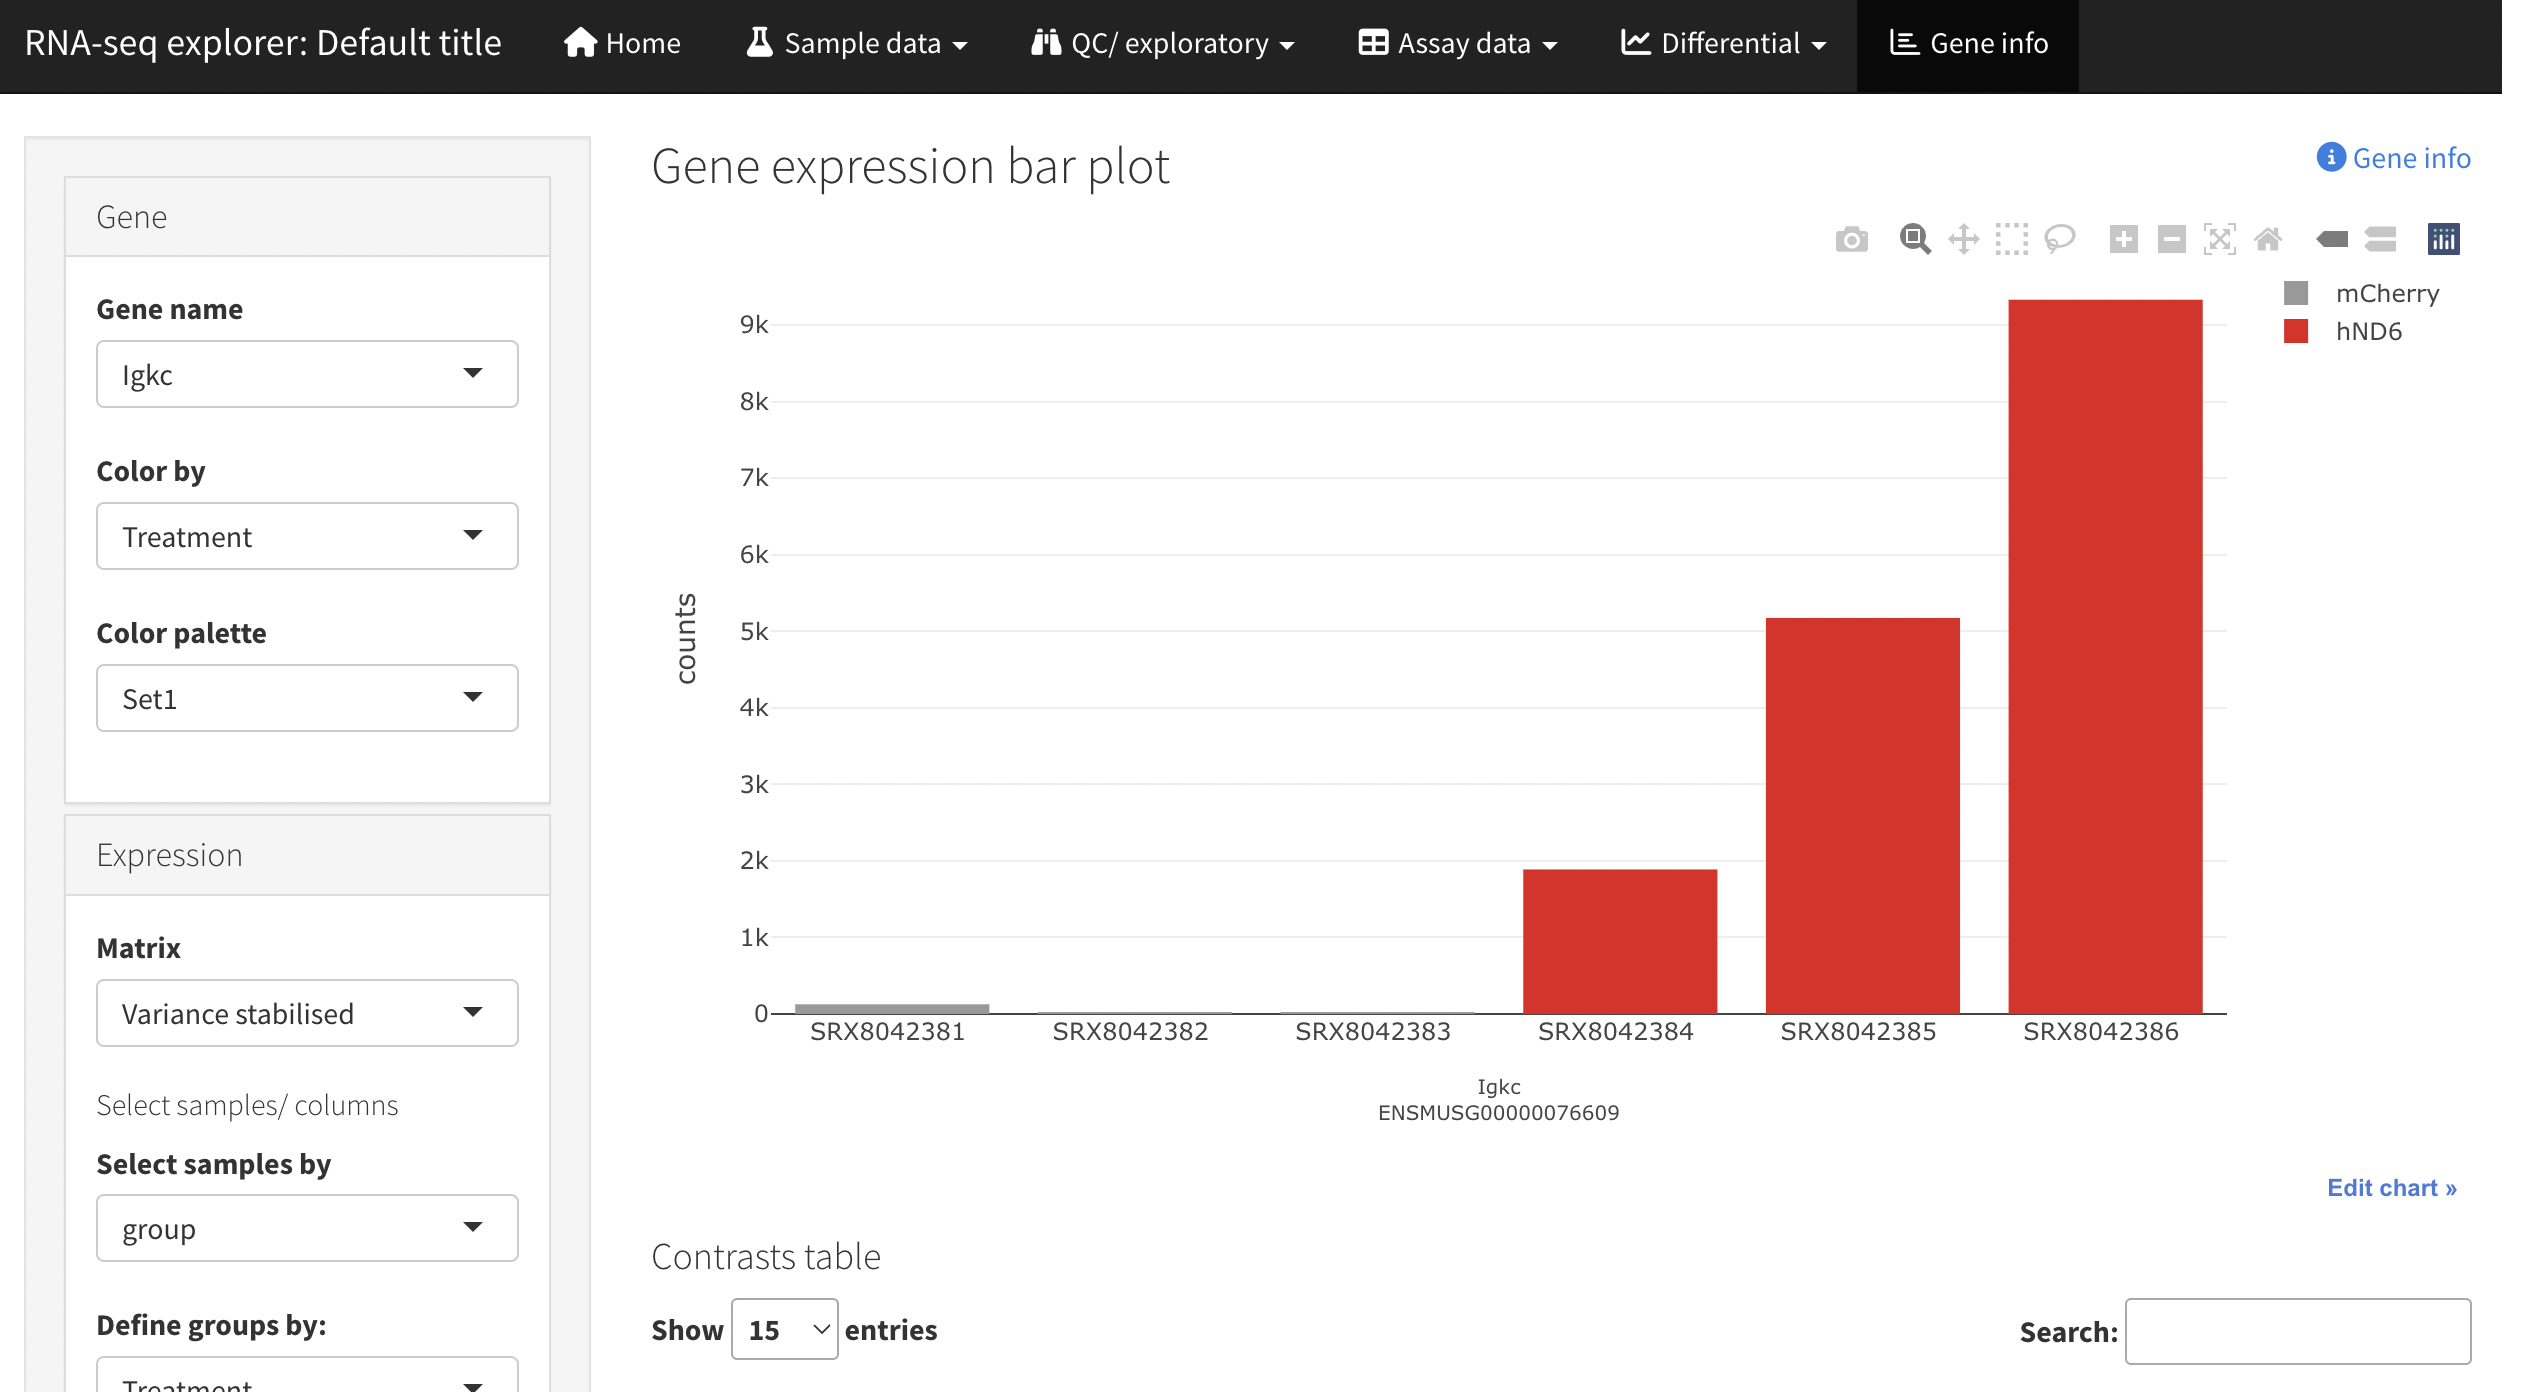
- Optionally build and (if specified) deploy a Shiny app for fully interactive mining of results.
- Build an HTML report based on Quarto markdown, with interactive plots (where possible) and tables.
Each of these steps can be looped over multiple parameter sets, through paramsheet files and the --paramset_name parameter. See the usage documentation for more information.
Usage
If you are new to Nextflow and nf-core, please refer to this page on how to set-up Nextflow. Make sure to test your setup with -profile test before running the workflow on actual data.
The paramsheet file (ie. paramsheet.yaml) stored in the conf directory defines the combination of tools and parameters that make sense to run for a given study type. You can use the flag --paramset_name to specify which set of tools to run. For example:
RNA-seq with deseq2:
 nextflow run nf-core/differentialabundance \
     --input samplesheet.csv \
     --contrasts contrasts.yaml \
     --matrix assay_matrix.tsv \
     --gtf mouse.gtf \
     --outdir <OUTDIR>  \
     -profile <docker/singularity/podman/shifter/charliecloud/conda/institute> \
--paramset_name deseq2_rnaseqIf you are using the outputs of the nf-core rnaseq workflow as input here either:
- supply the raw count matrices (file names like gene_counts.tsv) alongide the transcript length matrix via
--transcript_length_matrix(rnaseq versions >=3.12.0, preferred) - or supply the gene_counts_length_scaled.tsv or gene_counts_scaled.tsv matrices.
RNA-seq limma+voom:
 nextflow run nf-core/differentialabundance \
     --input samplesheet.csv \
     --contrasts contrasts.yaml \
     --matrix assay_matrix.tsv \
     --gtf mouse.gtf \
     --outdir <OUTDIR>  \
     -profile <docker/singularity/podman/shifter/charliecloud/conda/institute> \
--paramset_name limma_rnaseqIf you are using the outputs of the nf-core rnaseq workflow as input here you should provide either the gene_counts_length_scaled.tsv or gene_counts_scaled.tsv matrices. This follows the recommendation from the tximport documentation:
“Because limma-voom does not use the offset matrix stored in
y$offset, we recommend using scaled counts generated from abundances, either ‘scaledTPM’ or ‘lengthScaledTPM’.”
See the usage documentation for more information.
Affymetrix microarray:
 nextflow run nf-core/differentialabundance \
     --input samplesheet.csv \
     --contrasts contrasts.yaml \
     --affy_cel_files_archive cel_files.tar \
     --outdir <OUTDIR>  \
     -profile <docker/singularity/podman/shifter/charliecloud/conda/institute> \
--paramset_name limma_affyPlease provide pipeline parameters via the CLI or Nextflow -params-file option. Custom config files including those provided by the -c Nextflow option can be used to provide any configuration except for parameters; see docs.
RNA-seq with deseq2 and GSEA:
 nextflow run nf-core/differentialabundance \
     --input samplesheet.csv \
     --contrasts contrasts.yaml \
     --matrix assay_matrix.tsv \
     --gtf mouse.gtf \
     --outdir <OUTDIR>  \
     -profile <docker/singularity/podman/shifter/charliecloud/conda/institute> \
     --paramset_name deseq2_rnaseq_gsea
You could also provide your own paramsheet through the --paramsheet parameter.
For more details and further functionality, please refer to the usage documentation and the parameter documentation.
Reporting
The pipeline reports its outcomes in two forms.
Quarto notebook and HTML
The primary workflow output is an HTML-format report produced from an Quarto notebook template (you can also supply your own). This leverages helper functions from shinyngs to produce rich plots and tables, but does not provide significant interactivity.

Additionally, a zip file is produced by the pipeline, containing a Quarto notebook file and all necessary file inputs for reporting. The notebook file is the same as the input template, but with the parameters set appropriately, so that you can run the reporting yourself in RStudio, and add any customisations you need.
Shiny-based data mining app
A second optional output is produced by leveraging shinyngs to build an interactive Shiny application. This allows more interaction with the data, setting of thresholds etc.


By default the application is provided as an R script and associated serialised data structure, which you can use to quickly start the application locally. With proper configuration the app can also be deployed to shinyapps.io - though this requires you to have an account on that service (free tier available).
Pipeline output
To see the results of an example test run with a full size dataset refer to the results tab on the nf-core website pipeline page. For more details about the output files and reports, please refer to the output documentation.
Credits
nf-core/differentialabundance was originally written by Jonathan Manning (@pinin4fjords) and Oskar Wacker (@WackerO). Jonathan Manning (now at Seqera) initially worked on this workflow as an employee of Healx, an AI-powered, patient-inspired tech company, accelerating the discovery and development of treatments for rare diseases. Oskar Wacker works for QBiC at Tübingen University. We are grateful for the support of open science in this project.
Also, additional contributions were made by Suzanne Jin (@suzannejin), Cristina Araiz (@caraiz2001), Björn Langer (blanger), Jose Espinosa-Carrasco (@JoseEspinosa) and Júlia Mir Pedrol (@mirpedrol), from The Comparative Bioinformatics Group at The Centre for Genomic Regulation, Spain.
We thank the many members of the nf-core community who assisted with this pipeline, often by reviewing module pull requests including but not limited to:
- @ggabernet,
- @SPPearce,
- @nvnieuwk,
- @jfy133,
- @mahesh-panchal,
- @mashehu,
- @apeltzer
- @grst
- @atrigila
- @alanmmobbs93
- @nschcolnicov
Contributions and Support
If you would like to contribute to this pipeline, please see the contributing guidelines.
For further information or help, don’t hesitate to get in touch on the Slack #differentialabundance channel (you can join with this invite).
Citations
If you use nf-core/differentialabundance for your analysis, please cite it using the following doi: 10.5281/zenodo.7568000.
An extensive list of references for the tools used by the pipeline can be found in the CITATIONS.md file.
This pipeline uses code and infrastructure developed and maintained by the nf-core community, reused here under the MIT license.
You can cite the nf-core publication as follows:
The nf-core framework for community-curated bioinformatics pipelines.
Philip Ewels, Alexander Peltzer, Sven Fillinger, Harshil Patel, Johannes Alneberg, Andreas Wilm, Maxime Ulysse Garcia, Paolo Di Tommaso & Sven Nahnsen.
Nat Biotechnol. 2020 Feb 13. doi: 10.1038/s41587-020-0439-x.